🚀 ¡BNB IN A CONSOLIDATION ZONE: SUPPORT AND KEY TREND! ⚡
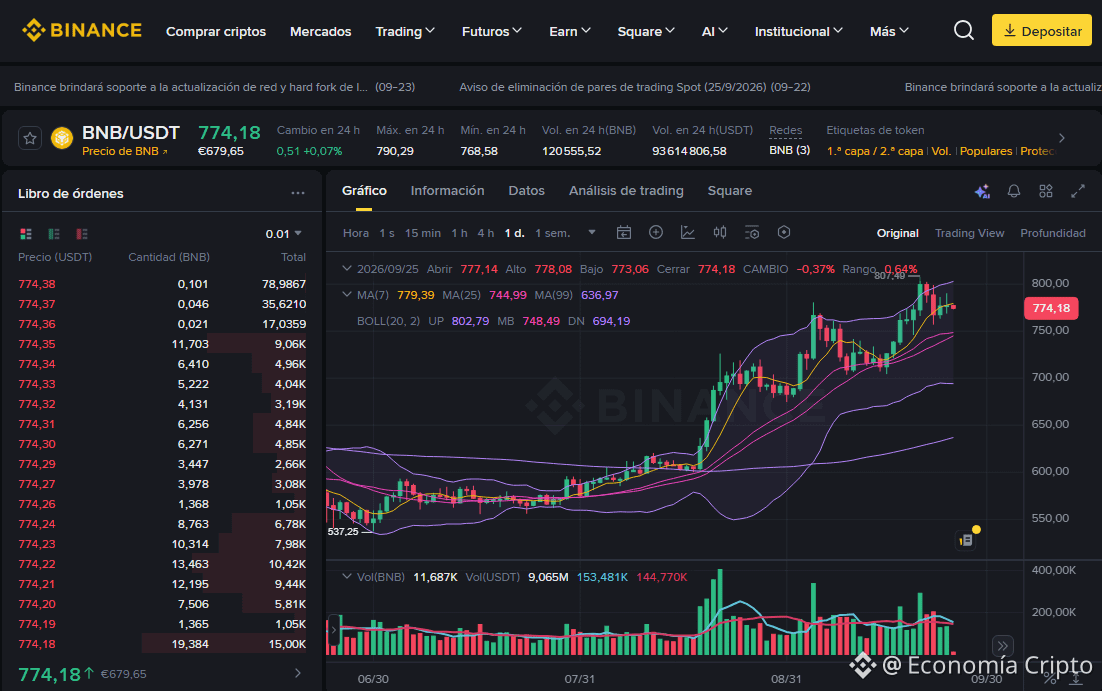
The BNB/USDT pair is trading at 774.18, recording a change of +0.07% over the last 24 hours. The daily session shows an open at 777.14, a high of 778.08, a low of 773.06, and a close at 774.18 (-0.37%), reflecting a pause phase and technical consolidation in the market.
🔍 Trend Analysis and Indicators
Trend: Sideways-to-bullish in the short term within a strong long-term macro uptrend structure.
Moving Averages: The price is very close, slightly below the MA(7) (779.39), but remains firmly above the MA(25) (744.99) and the long-term trend supported by the MA(99) (636.97).
Bollinger Bands: Price is oscillating after pulling back from the upper band UP (802.79), seeking stability near the middle band MB (748.49), with the lower band located at DN (694.19).
Key Levels: Immediate support is in the 768.58 - 773.06 area, while the main resistance to break lies at the recent highs of 790.29 - 802.79.
💡 Trading Strategy: Buy or Sell?
Buy (Long)?: Stability above the medium-term moving averages offers a tactical accumulation opportunity at support levels, managing risk strictly.
Sell (Short)?: Trading to the downside implies higher risk due to the strength of the main trend; it would only be considered in the event of a deep and sustained loss of the lower supports.
#BNB #AnalisisTecnico #CryptoTrading
The Lord blesses and prospers those who operate here, in the name of Jesus, because your word says: "Mine is the silver, and mine is the gold," says the LORD of hosts. Hageo 2:8 RV1960-T -
$BNB
The BNB/USDT pair is trading at 774.18, recording a change of +0.07% over the last 24 hours. The daily session shows an open at 777.14, a high of 778.08, a low of 773.06, and a close at 774.18 (-0.37%), reflecting a pause phase and technical consolidation in the market.
🔍 Trend Analysis and Indicators
Trend: Sideways-to-bullish in the short term within a strong long-term macro uptrend structure.
Moving Averages: The price is very close, slightly below the MA(7) (779.39), but remains firmly above the MA(25) (744.99) and the long-term trend supported by the MA(99) (636.97).
Bollinger Bands: Price is oscillating after pulling back from the upper band UP (802.79), seeking stability near the middle band MB (748.49), with the lower band located at DN (694.19).
Key Levels: Immediate support is in the 768.58 - 773.06 area, while the main resistance to break lies at the recent highs of 790.29 - 802.79.
💡 Trading Strategy: Buy or Sell?
Buy (Long)?: Stability above the medium-term moving averages offers a tactical accumulation opportunity at support levels, managing risk strictly.
Sell (Short)?: Trading to the downside implies higher risk due to the strength of the main trend; it would only be considered in the event of a deep and sustained loss of the lower supports.
#BNB #AnalisisTecnico #CryptoTrading
The Lord blesses and prospers those who operate here, in the name of Jesus, because your word says: "Mine is the silver, and mine is the gold," says the LORD of hosts. Hageo 2:8 RV1960-T -
$BNB