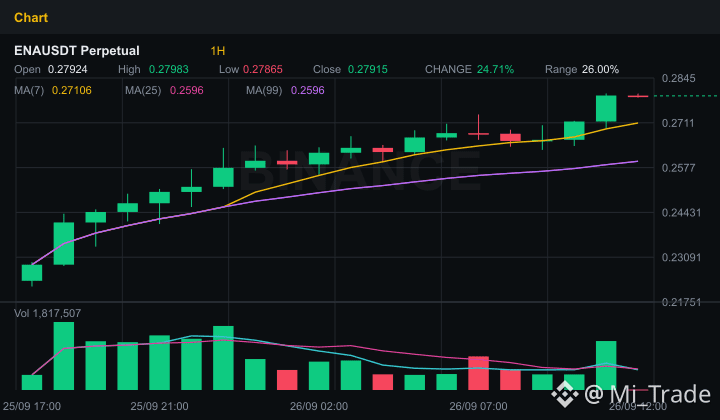
🚨 $ENA Is This Stable or a Price-Increase Trap? A Deep Look Through Derivatives Data! 🚀
The crypto market is always ruthless, and if you’re holding $ENA without clearly understanding the numbers below, chances are you’re trading in the dark. Let’s quickly break down the current fund flow situation to see whether the bulls or the bears are holding the strings!
Technical View & Current Fund Flow:
• Short-term trend: The M15 and H1 charts are both aligned in bright green (bullish), indicating that upward price momentum is still being maintained quite well.
• Momentum (RSI & MACD): RSI-14 is hovering around 67.7—buy pressure is very strong, but it hasn’t yet reached the extremely overbought threshold (> 70). MACD is also supporting the buyers.
• Open Interest (OI) explodes: OI surged to more than 161.5 million USD, while rising 4.45% within just the past hour. Money is pouring aggressively into the derivatives market!
• Trading sentiment: The taker buy/sell ratio is 1.181, meaning buyers are actively executing orders at market prices more than sellers. Whales and the crowd are on the same side—Long—with the global Long ratio dominating at 62.9%.
• Key price levels "make-or-break":
- Nearest resistance: 0.27988
- Hard support: 0.25931
So what’s the trading strategy for $ENA right now? Since RSI is nearing high levels and OI has surged strongly, the risk of a liquidity sweep (long squeeze) is absolutely possible if price touches resistance at 0.27988 but then loses momentum. Don’t chase with FOMO at the top—always split your capital and set your Stop Loss immediately below the support level of 0.25931 to protect your account.
Are you confident $ENA will successfully break above resistance, or will there be a bearish sweep first before it flies higher? Drop your thoughts in the comments below!
#ENA #BinanceSquare
The crypto market is always ruthless, and if you’re holding $ENA without clearly understanding the numbers below, chances are you’re trading in the dark. Let’s quickly break down the current fund flow situation to see whether the bulls or the bears are holding the strings!
Technical View & Current Fund Flow:
• Short-term trend: The M15 and H1 charts are both aligned in bright green (bullish), indicating that upward price momentum is still being maintained quite well.
• Momentum (RSI & MACD): RSI-14 is hovering around 67.7—buy pressure is very strong, but it hasn’t yet reached the extremely overbought threshold (> 70). MACD is also supporting the buyers.
• Open Interest (OI) explodes: OI surged to more than 161.5 million USD, while rising 4.45% within just the past hour. Money is pouring aggressively into the derivatives market!
• Trading sentiment: The taker buy/sell ratio is 1.181, meaning buyers are actively executing orders at market prices more than sellers. Whales and the crowd are on the same side—Long—with the global Long ratio dominating at 62.9%.
• Key price levels "make-or-break":
- Nearest resistance: 0.27988
- Hard support: 0.25931
So what’s the trading strategy for $ENA right now? Since RSI is nearing high levels and OI has surged strongly, the risk of a liquidity sweep (long squeeze) is absolutely possible if price touches resistance at 0.27988 but then loses momentum. Don’t chase with FOMO at the top—always split your capital and set your Stop Loss immediately below the support level of 0.25931 to protect your account.
Are you confident $ENA will successfully break above resistance, or will there be a bearish sweep first before it flies higher? Drop your thoughts in the comments below!
#ENA #BinanceSquare