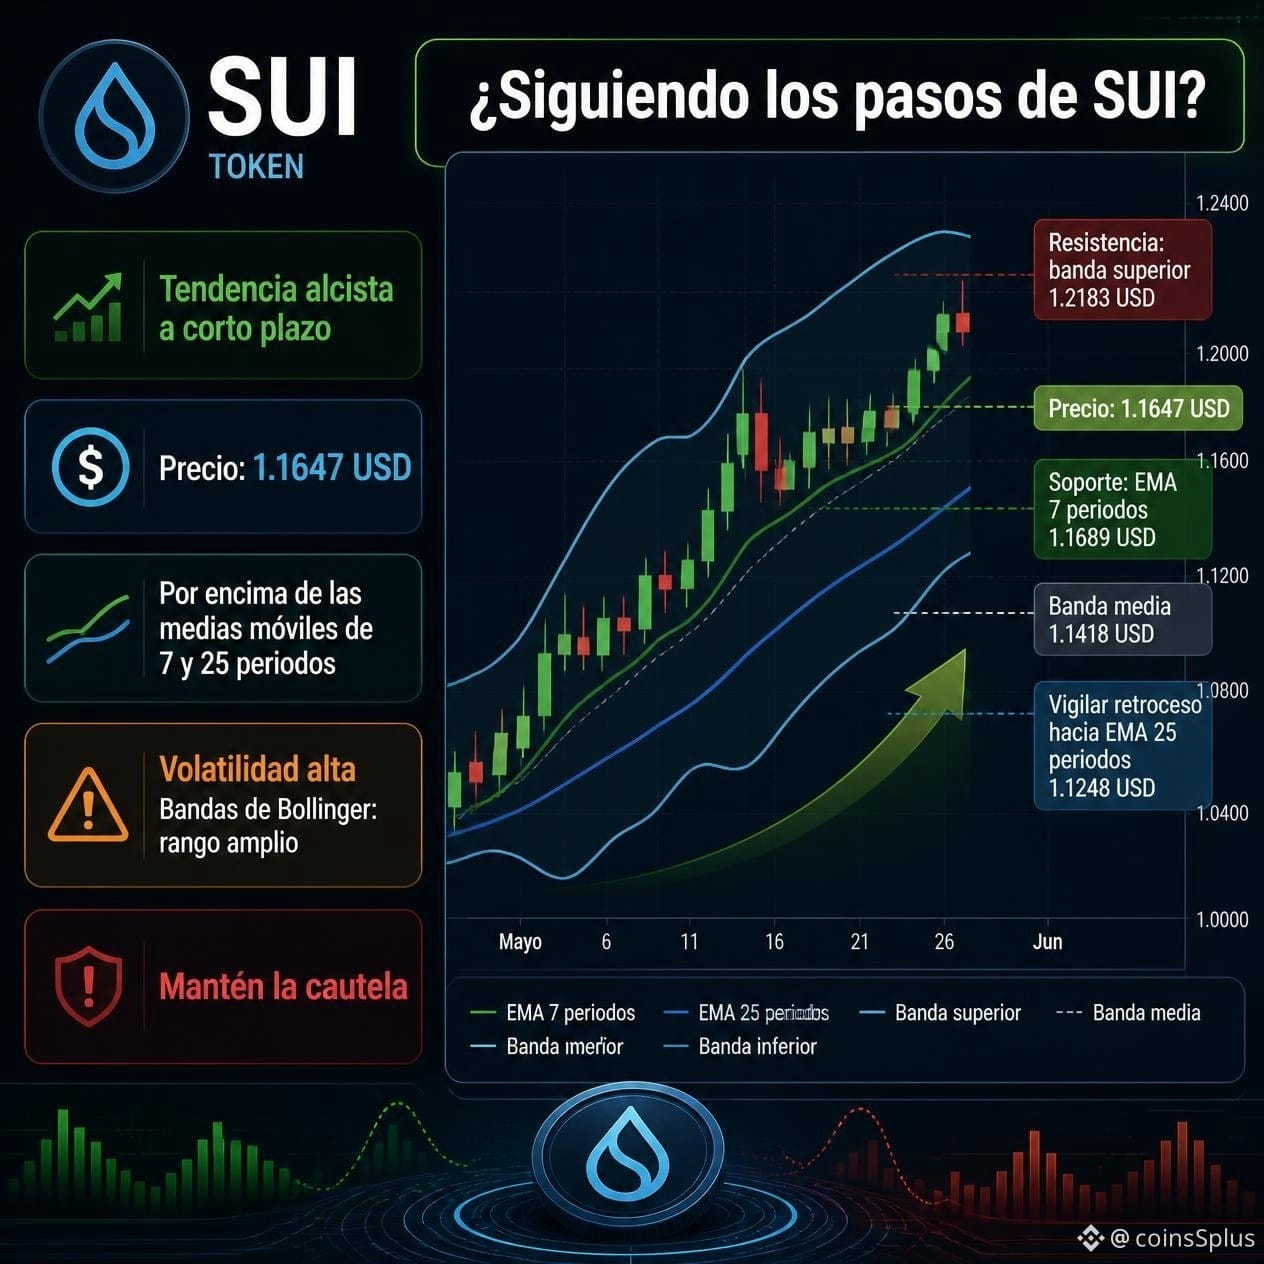
Following the steps of $SUI ? The token shows a bullish trend in the short term, trading at 1.1647 USD above its 7- and 25-period moving averages.
However, volatility is high and the Bollinger Bands show a wide range, which may translate into fairly quick price movements. If you assess the market, immediate resistance is located at the upper Bollinger Band at 1.2183 USD, while the key dynamic supports are at the 7-period EMA (1.1689 USD) and the middle band (1.1418 USD). Stay cautious about the potential for high volatility and watch to see if the price pulls back toward the 25-period EMA at 1.1248 USD!
However, volatility is high and the Bollinger Bands show a wide range, which may translate into fairly quick price movements. If you assess the market, immediate resistance is located at the upper Bollinger Band at 1.2183 USD, while the key dynamic supports are at the 7-period EMA (1.1689 USD) and the middle band (1.1418 USD). Stay cautious about the potential for high volatility and watch to see if the price pulls back toward the 25-period EMA at 1.1248 USD!