


Ethereum (ETH) Price Today: ETH/USDT Market Analysis for September 26, 2026
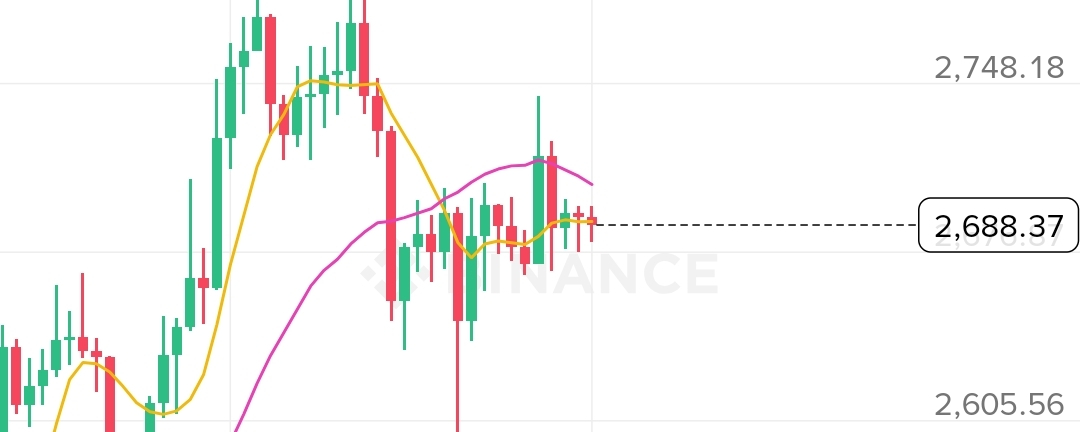
Ethereum (ETH) is trading around $2,688.37 against USDT, according to the Binance chart shared today. ETH is showing a modest 0.45% gain, while the 4-hour chart indicates that the market is currently consolidating after recent price movement.
Ethereum Price Today
The chart shows the following key levels:
Current Price: $2,688.37
24-Hour High: $2,743.00
24-Hour Low: $2,667.33
24H ETH Volume: 222,508.75 ETH
24H USDT Volume: $599.77 million
Recent Chart High: $2,807.34
Recent Chart Low: $2,564.33
ETH is currently trading close to the short-term MA(7) at $2,689.84, while the MA(25) is around $2,705.52 and the longer-term MA(99) is around $2,570.49.
ETH/USDT 4-Hour Chart Analysis
The 4-hour chart shows that Ethereum previously moved strongly upward, reaching approximately $2,807, before experiencing a pullback.
After the decline, ETH found buying activity around the $2,564–$2,605 area and subsequently recovered toward the $2,680–$2,700 region.
At the moment, the candles are relatively close together, suggesting a period of consolidation. This means traders may be watching for a clear move outside the current range.
Important Resistance Levels
The first area to watch is around $2,705–$2,743.
If ETH moves above this zone with strong volume, traders may then watch the previous chart high near $2,807.
Important Support Levels
On the downside, $2,667 is an important short-term level because it is close to the displayed 24-hour low.
Below that, the chart shows another important area around $2,605, followed by the previous swing-low region near $2,564.
What the Moving Averages Show
The current ETH price is almost exactly around the 7-period moving average:
MA(7): $2,689.84
The 25-period moving average is higher:
MA(25): $2,705.52
Meanwhile, the 99-period moving average is considerably lower:
MA(99): $2,570.49
This combination shows that ETH is in a short-term consolidation phase while remaining considerably above its longer-term MA(99) shown on this chart.
ETH Market Outlook
Based only on the chart provided, the key question for traders is whether Ethereum can establish a sustained move above the $2,700–$2,743 resistance area, or whether sellers push the price back toward the $2,667 and $2,605 support areas.
A breakout accompanied by increasing trading volume would provide stronger confirmation than a move on weak volume. Similarly, a breakdown below support would need to be watched for follow-through rather than relying on a single candle.
Crypto prices can change rapidly, so the levels shown in this article may become outdated as the market moves.
Key ETH Levels at a Glance
LevelImportance$2,807Recent chart high$2,74324H high / resistance area$2,705MA(25)$2,688Current price$2,66724H low / short-term support$2,605Lower support area$2,564Previous chart low$2,570MA(99)
Final Note
Ethereum is currently trading near $2,688, with the 4-hour chart showing consolidation after a previous rise and pullback. The $2,667–$2,743 range is an important area to monitor, while $2,807 remains a notable previous high on the displayed chart.
This article is for educational and informational purposes only and is not financial advice. Always do your own research before trading or investing in cryptocurrency.
#Ethereum #ETH #ETHUSDT #EthereumPrice #CryptoMarket #Binance #CryptoNews #ETHAnalysis #Cryptocurrency #Trading