#TAKE
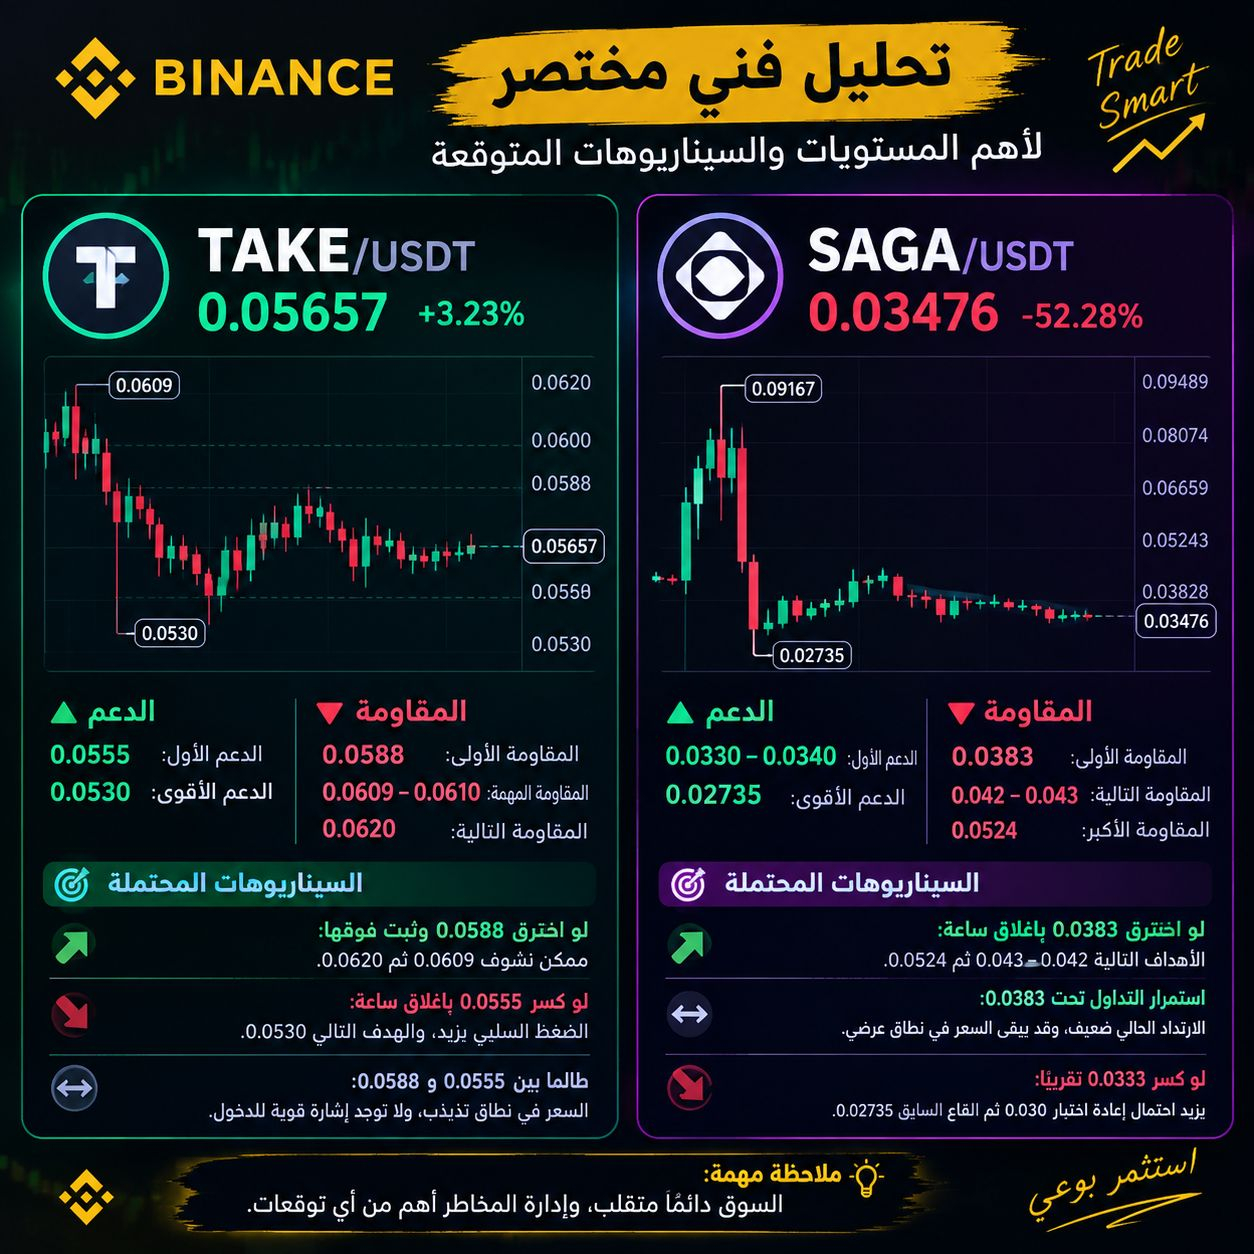
Technical analysis from the chart
The short-term trend is currently slightly bearish (inclined to decline) after the price was rejected from the 0.0600–0.0610 area.
There is a clear accumulation around 0.0555–0.0560; the price is trying to hold above it.
First support: 0.0555
Stronger support: 0.0530
First resistance: 0.0588
Important resistance: 0.0609–0.0610
After that, resistance is around 0.0620.
Scenarios
If it breaks 0.0588 and holds above it:
We could see an attempt toward 0.0609, then 0.0620. Most importantly, the breakout should be confirmed by a 1-hour candle close—not just a wick.
If it breaks 0.0555 with a 1-hour close:
Negative pressure increases, and the area I’m watching next is 0.0530.
As long as it stays between 0.0555 and 0.0588:
The price is in a range of fluctuations, and there is no strong signal on the chart alone that calls for chasing an entry.
Technical analysis from the chart
The short-term trend is currently slightly bearish (inclined to decline) after the price was rejected from the 0.0600–0.0610 area.
There is a clear accumulation around 0.0555–0.0560; the price is trying to hold above it.
First support: 0.0555
Stronger support: 0.0530
First resistance: 0.0588
Important resistance: 0.0609–0.0610
After that, resistance is around 0.0620.
Scenarios
If it breaks 0.0588 and holds above it:
We could see an attempt toward 0.0609, then 0.0620. Most importantly, the breakout should be confirmed by a 1-hour candle close—not just a wick.
If it breaks 0.0555 with a 1-hour close:
Negative pressure increases, and the area I’m watching next is 0.0530.
As long as it stays between 0.0555 and 0.0588:
The price is in a range of fluctuations, and there is no strong signal on the chart alone that calls for chasing an entry.