$BTW
Response,
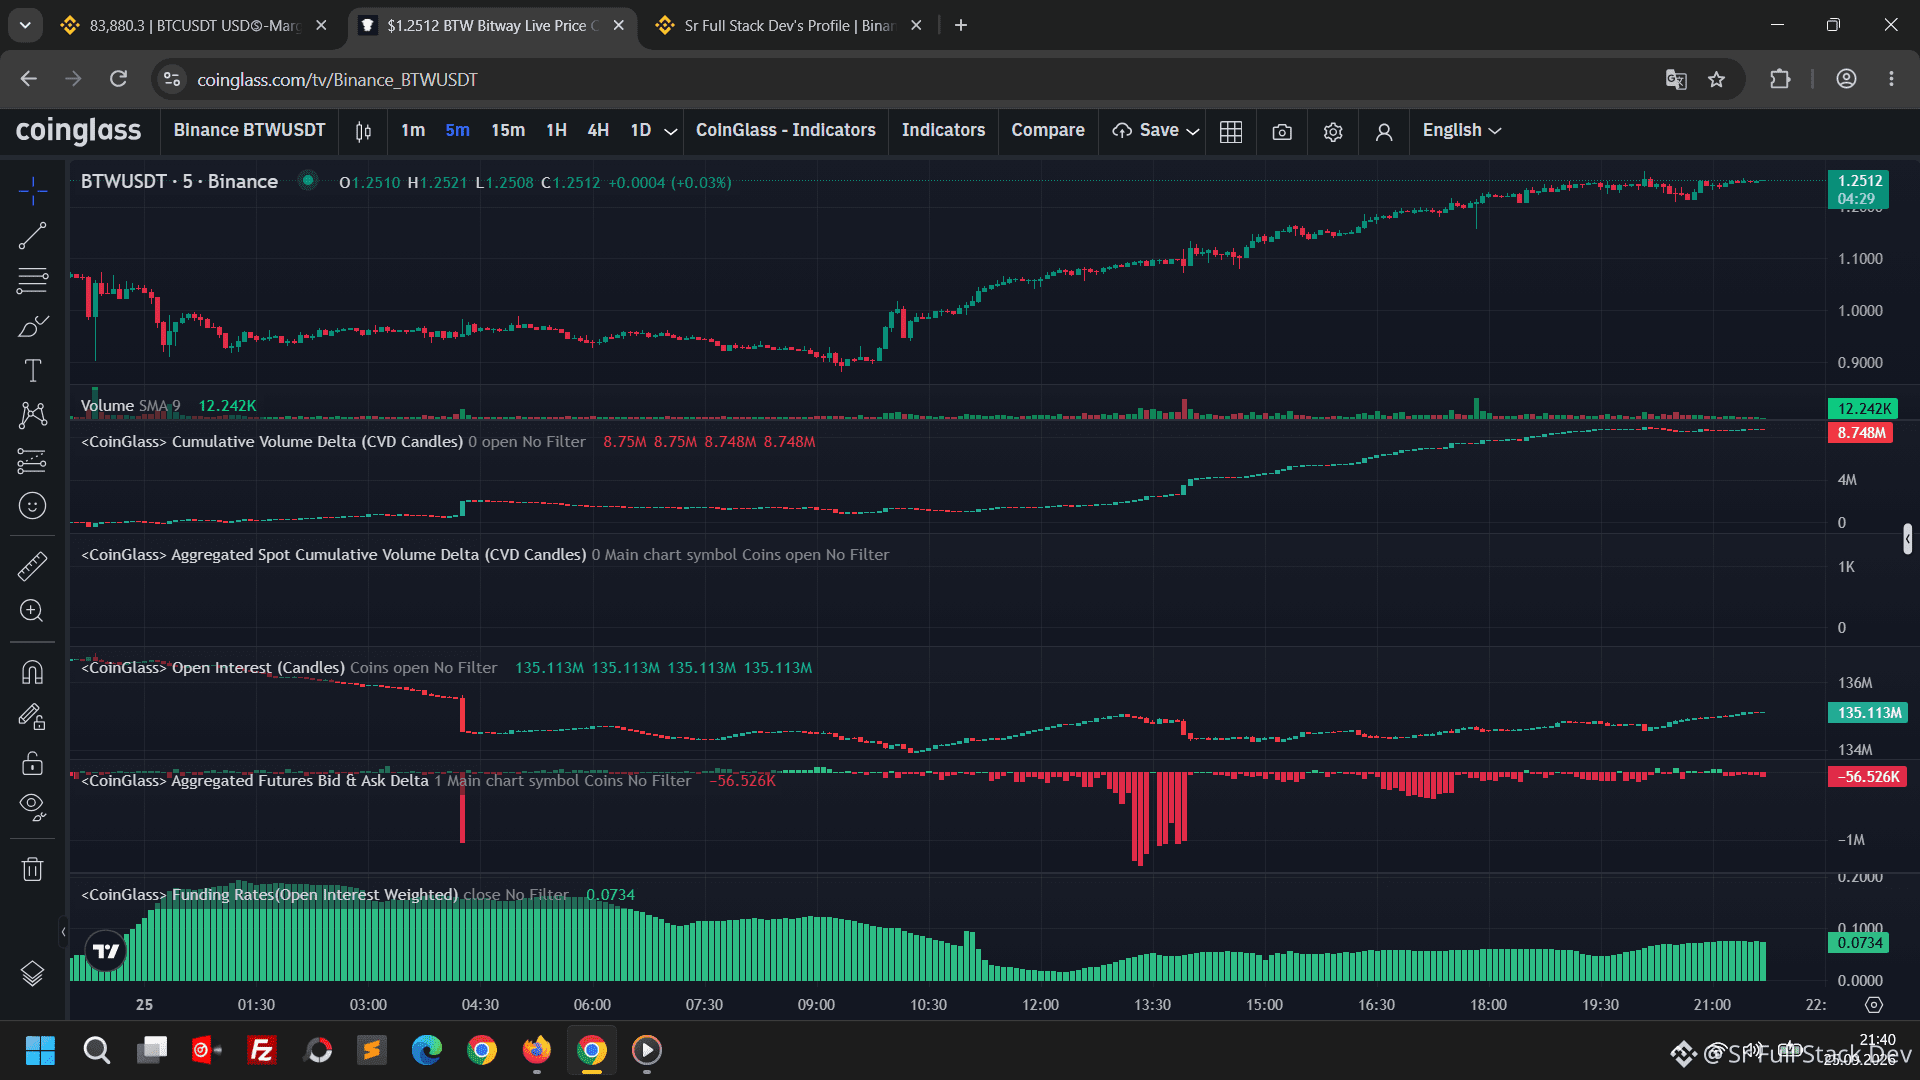
Order book updated. My short trade entries were updated and one got triggered. I planned an aggressive scalp DCA with volume at three times the position’s avg. It will execute when the DCA conditions are met. If the conditions do not occur, it will be postponed.
From the chart,
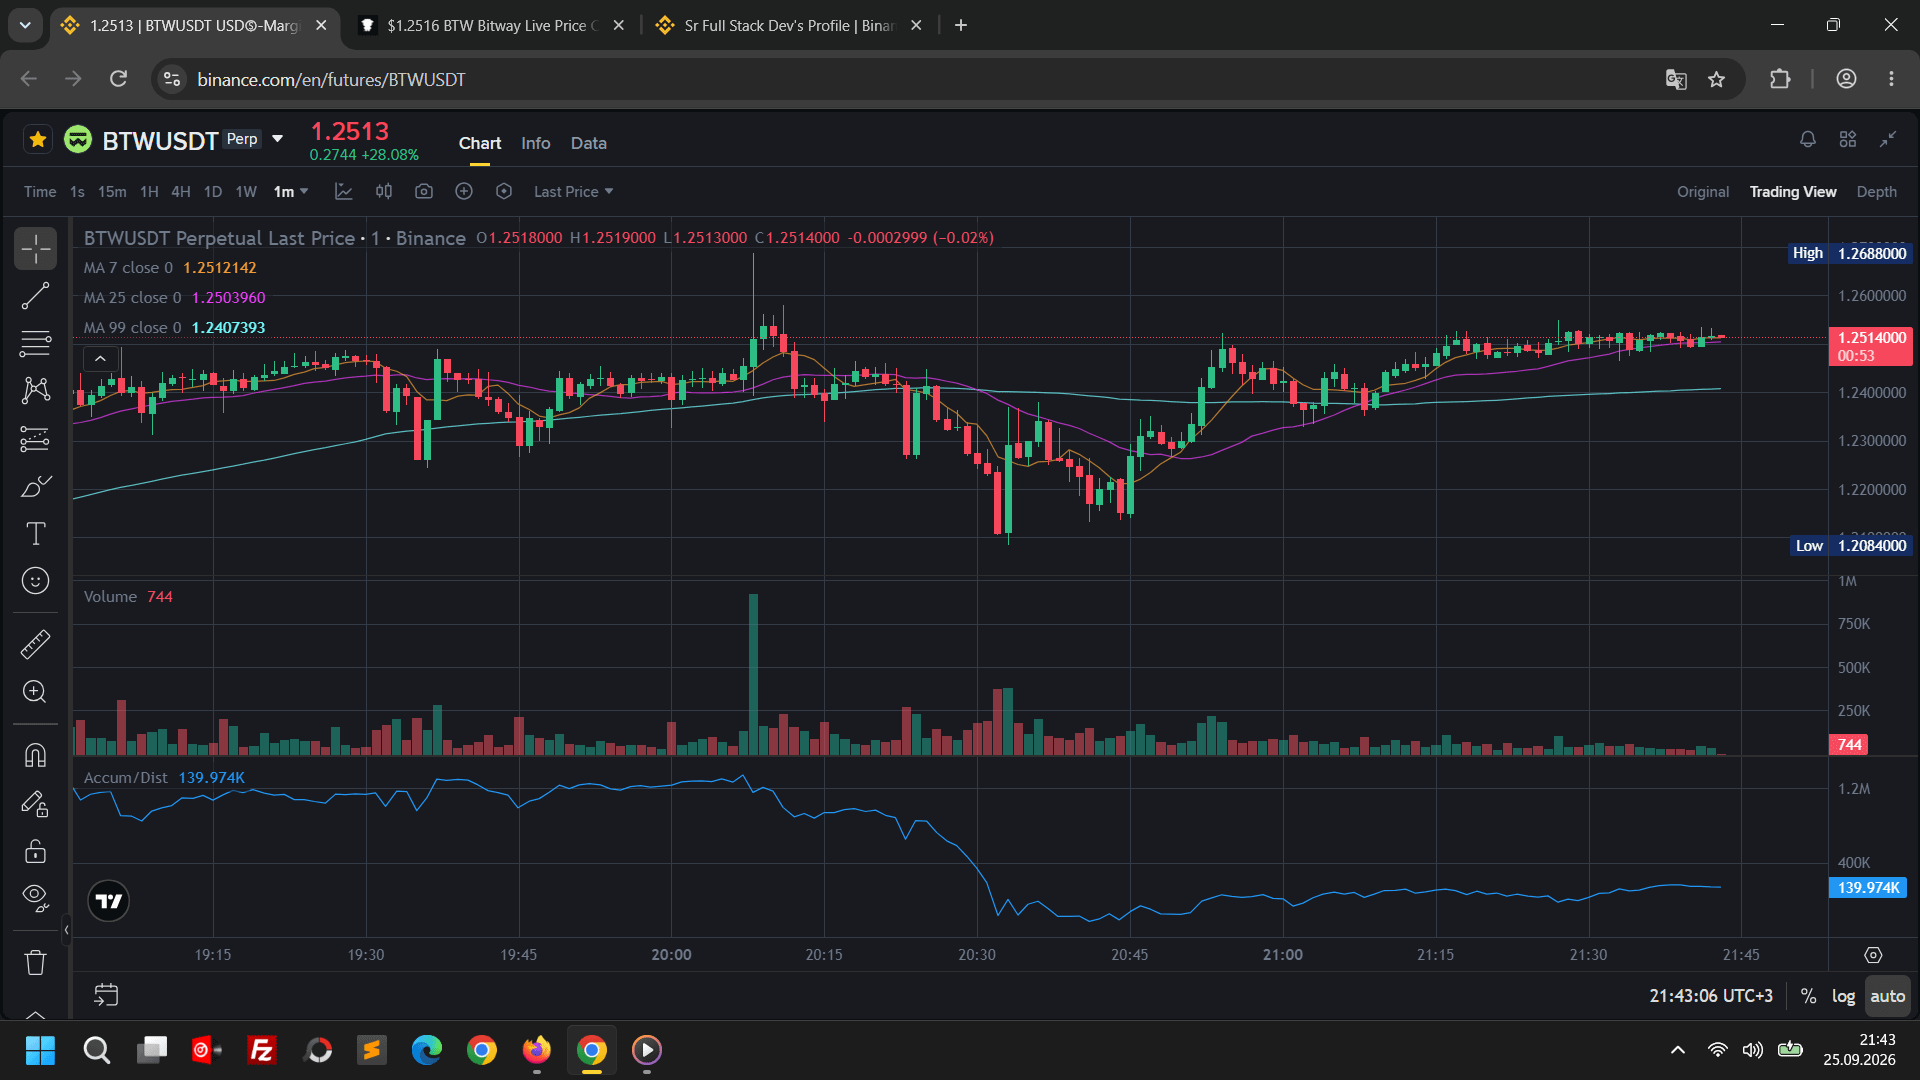
MA25 1.2404 is currently above the short-term average at the 1.2447 level. On downward moves, it acts as the first micro support.
MA99 1.2375 is the strong average that sets the main direction; it looks like it has formed a solid base just below the price. As long as price stays above this level, the algorithm may continue producing artificially green candles (!) (when I was writing, price was at this level).
The averages coming close to each other confirms the squeeze. It could break either downward or upward, or form a single high-volume candle.
With the last high-volume green candle, price rose to the 1.2447 level, but the volume accompanying that candle is only 16.542K. The current 16.5K volume proves that this rise is entirely an artificial liquidity pump. A green candle forms, but there’s no volume. This could be at the final stage of the upward move, and it may align with our expectation of an aggressive sell-to-close and dump-breakdown (not certain).
On the chart, the accumulation/distribution (accum-dist) indicator suggests hidden distribution. As price climbs, whales could be distributing in the background. The market maker keeps the price up with low volume to pull in spot and long positions. A classic trap. In reality, there are very few genuine buyers—robot trades dominate.
Conclusion,
In the green candles, volume is already used up. Once a series of long red candles with volume starts forming and the retests fail, shorts can be considered. Predictions do not include certainty. Not investment advice.
#xau #btc #eth #sol #doge
Response,
Order book updated. My short trade entries were updated and one got triggered. I planned an aggressive scalp DCA with volume at three times the position’s avg. It will execute when the DCA conditions are met. If the conditions do not occur, it will be postponed.
From the chart,
MA25 1.2404 is currently above the short-term average at the 1.2447 level. On downward moves, it acts as the first micro support.
MA99 1.2375 is the strong average that sets the main direction; it looks like it has formed a solid base just below the price. As long as price stays above this level, the algorithm may continue producing artificially green candles (!) (when I was writing, price was at this level).
The averages coming close to each other confirms the squeeze. It could break either downward or upward, or form a single high-volume candle.
With the last high-volume green candle, price rose to the 1.2447 level, but the volume accompanying that candle is only 16.542K. The current 16.5K volume proves that this rise is entirely an artificial liquidity pump. A green candle forms, but there’s no volume. This could be at the final stage of the upward move, and it may align with our expectation of an aggressive sell-to-close and dump-breakdown (not certain).
On the chart, the accumulation/distribution (accum-dist) indicator suggests hidden distribution. As price climbs, whales could be distributing in the background. The market maker keeps the price up with low volume to pull in spot and long positions. A classic trap. In reality, there are very few genuine buyers—robot trades dominate.
Conclusion,
In the green candles, volume is already used up. Once a series of long red candles with volume starts forming and the retests fail, shorts can be considered. Predictions do not include certainty. Not investment advice.
#xau #btc #eth #sol #doge