Classic—this spot is indeed a bit tricky.
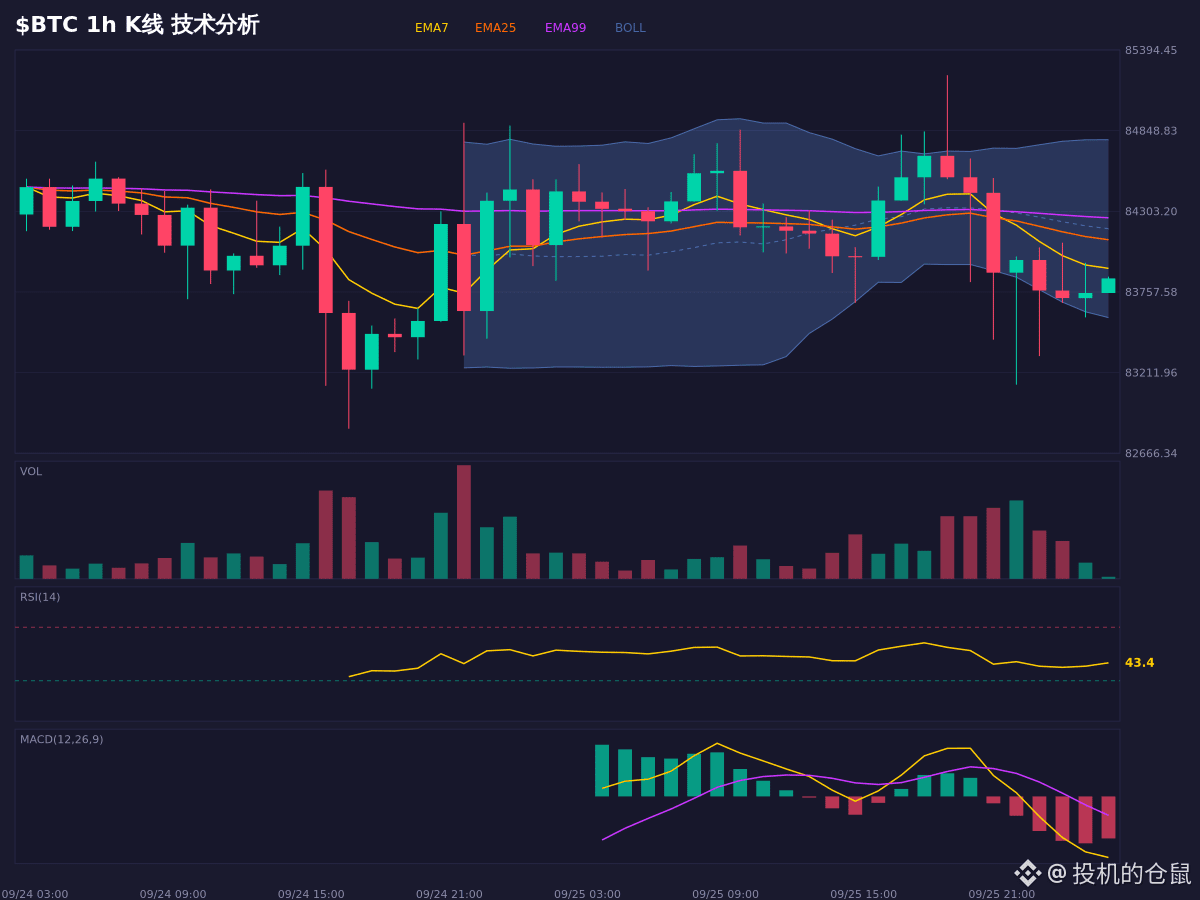
At present, $BTC is trading below the Bollinger Band middle line. It looks somewhat weak, but the Stoch RSI is oversold and showing a bullish divergence, so there’s a fairly good chance of a short-term rebound.
The funding rate is neutral-to-slightly bullish, but the long/short ratio indicates that the longs are pulling back.
If price holds above the EMA25 (84106.76), the bullish structure can continue; if it breaks below 83929.97 (Fib 61.8%), the rebound thesis will fail.
If it breaks through 85746.76 (previous high + 1× ATR), the currently bearish logic is completely reversed.
Only for chart observation and scenario forecasting; this does not constitute a trading instruction or record.
$BTC #熊市 #合约 #Market sentiment
At present, $BTC is trading below the Bollinger Band middle line. It looks somewhat weak, but the Stoch RSI is oversold and showing a bullish divergence, so there’s a fairly good chance of a short-term rebound.
The funding rate is neutral-to-slightly bullish, but the long/short ratio indicates that the longs are pulling back.
If price holds above the EMA25 (84106.76), the bullish structure can continue; if it breaks below 83929.97 (Fib 61.8%), the rebound thesis will fail.
If it breaks through 85746.76 (previous high + 1× ATR), the currently bearish logic is completely reversed.
Only for chart observation and scenario forecasting; this does not constitute a trading instruction or record.
$BTC #熊市 #合约 #Market sentiment