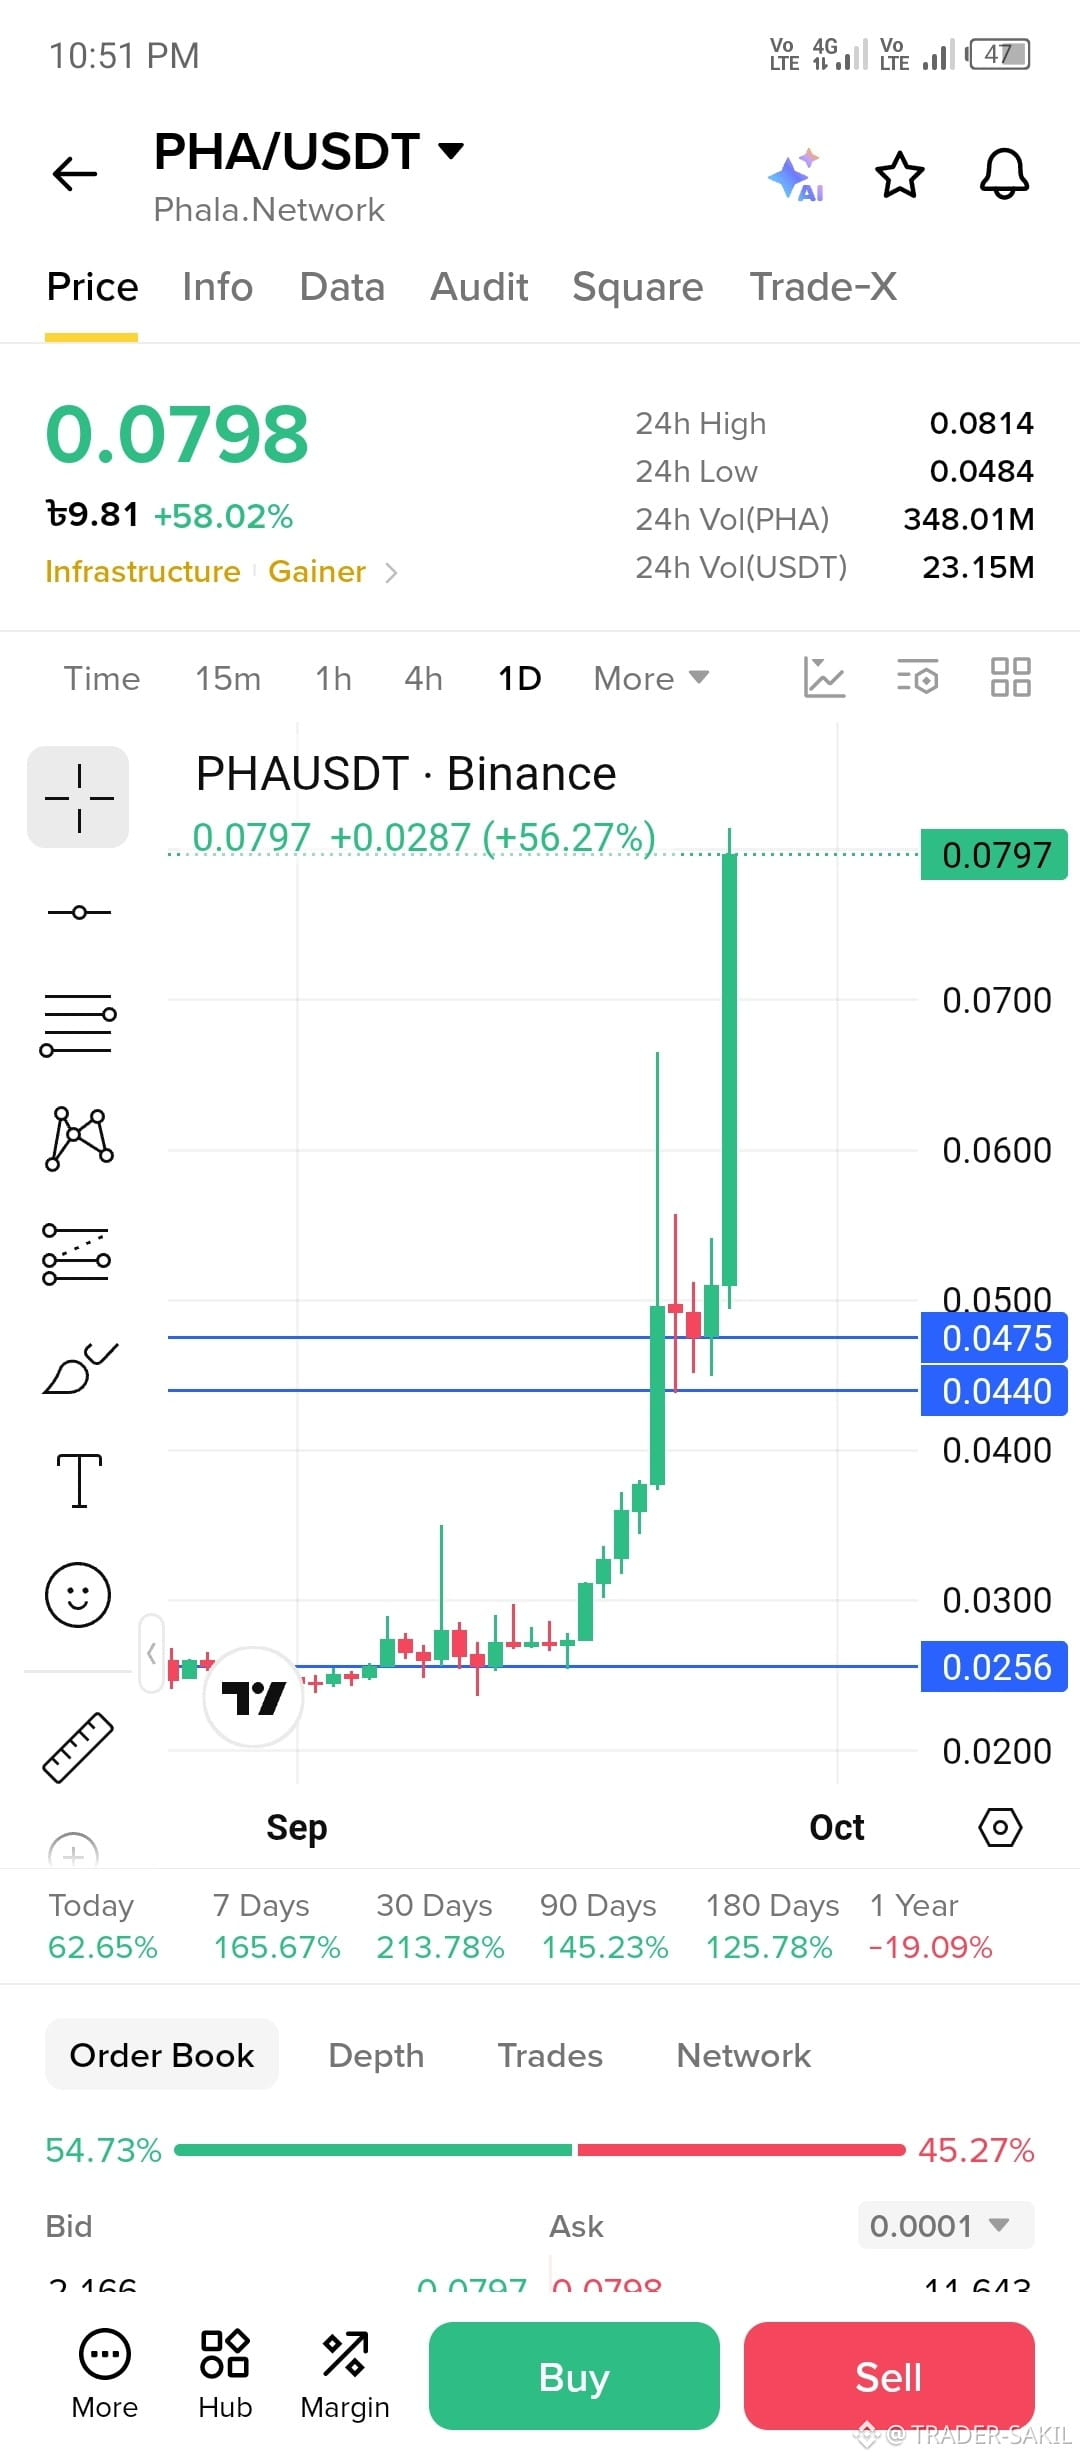
$PHA Current price: around $0.0798, up roughly 58% in 24h.
Trend: Strongly bullish. The 1D chart shows a rapid move from around $0.025–$0.03 into the $0.08 area.
Breakout: Price pushed above the marked $0.0475 resistance and continued higher, showing strong buying momentum.
Key levels:
$0.0475 — important breakout/support area
$0.0440 — secondary support
$0.0256 — major lower support
$0.0814 — current 24h high / nearby resistance
Momentum: The huge green daily candle indicates aggressive buying, but after such a fast rise, volatility and pullback risk are also high.
Volume: 24h PHA volume is shown around 348M PHA, indicating heavy trading activity.
Caveat: The chart is heavily extended after the sharp rally. A move back toward $0.0475–$0.0440 would not automatically invalidate the broader uptrend; it could simply represent a pullback. Also, the screenshot shows only a limited historical window, so it isn't enough by itself to confirm a long-term trend.
Trend: Strongly bullish. The 1D chart shows a rapid move from around $0.025–$0.03 into the $0.08 area.
Breakout: Price pushed above the marked $0.0475 resistance and continued higher, showing strong buying momentum.
Key levels:
$0.0475 — important breakout/support area
$0.0440 — secondary support
$0.0256 — major lower support
$0.0814 — current 24h high / nearby resistance
Momentum: The huge green daily candle indicates aggressive buying, but after such a fast rise, volatility and pullback risk are also high.
Volume: 24h PHA volume is shown around 348M PHA, indicating heavy trading activity.
Caveat: The chart is heavily extended after the sharp rally. A move back toward $0.0475–$0.0440 would not automatically invalidate the broader uptrend; it could simply represent a pullback. Also, the screenshot shows only a limited historical window, so it isn't enough by itself to confirm a long-term trend.