LONG $DYM | The market is rising, but momentum is getting overheated, and the LONG side is paying the price
🚨 AI TRADE ALERT — $DYM
🟢 LONG
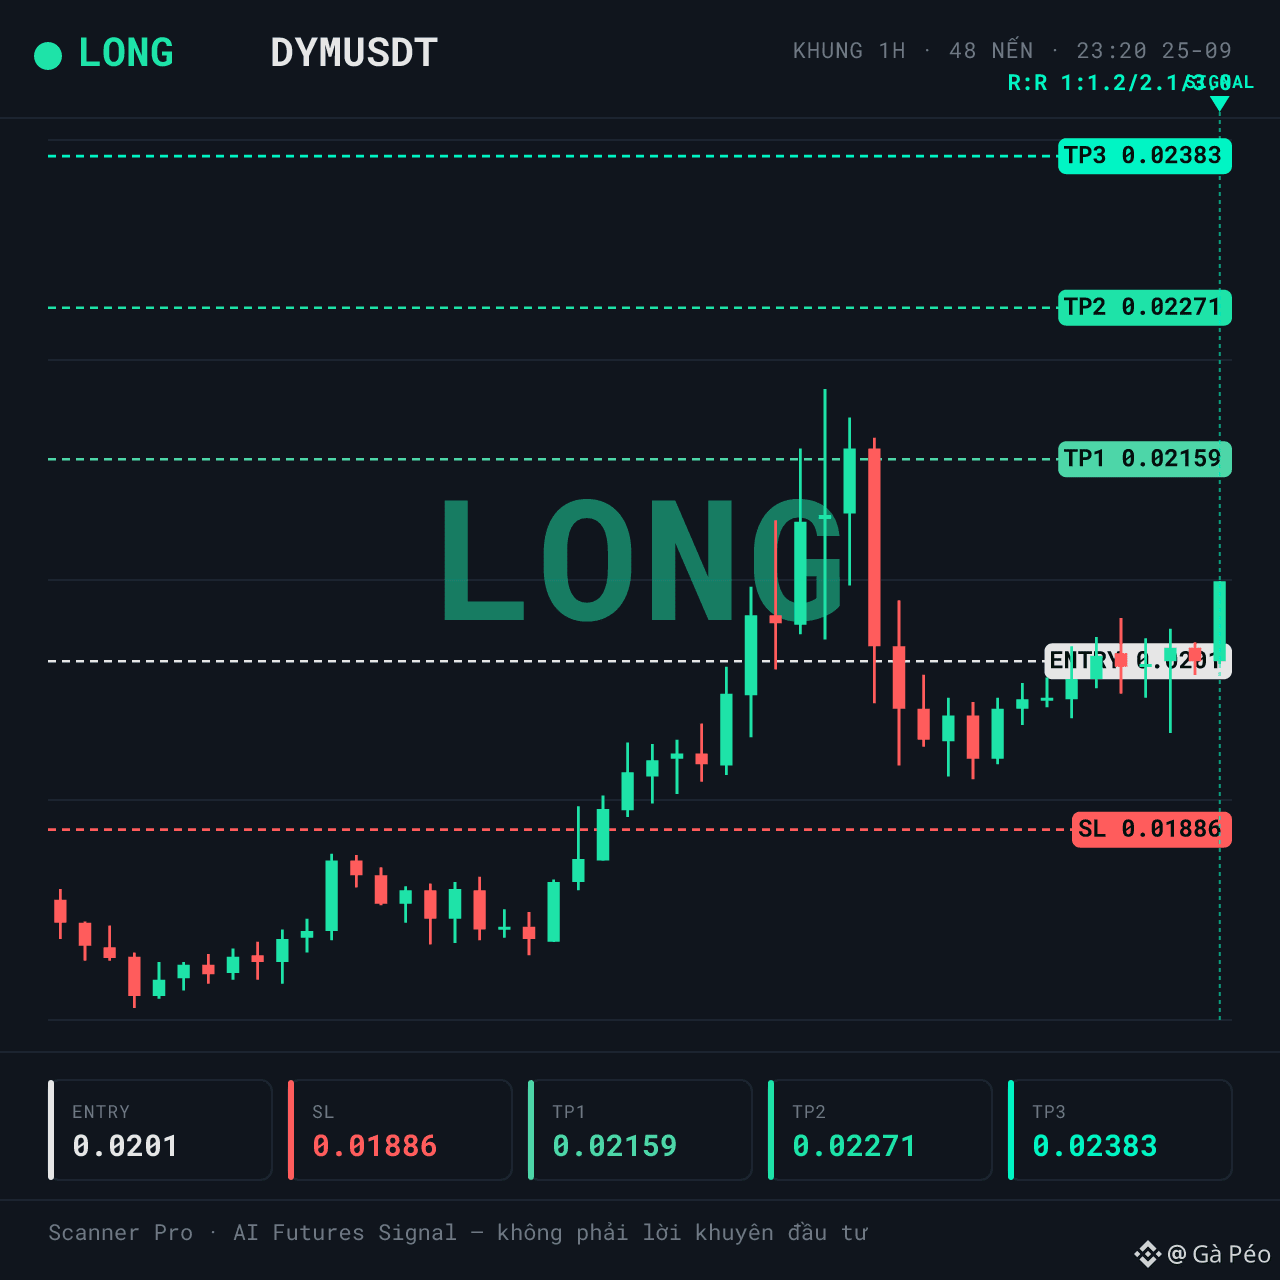
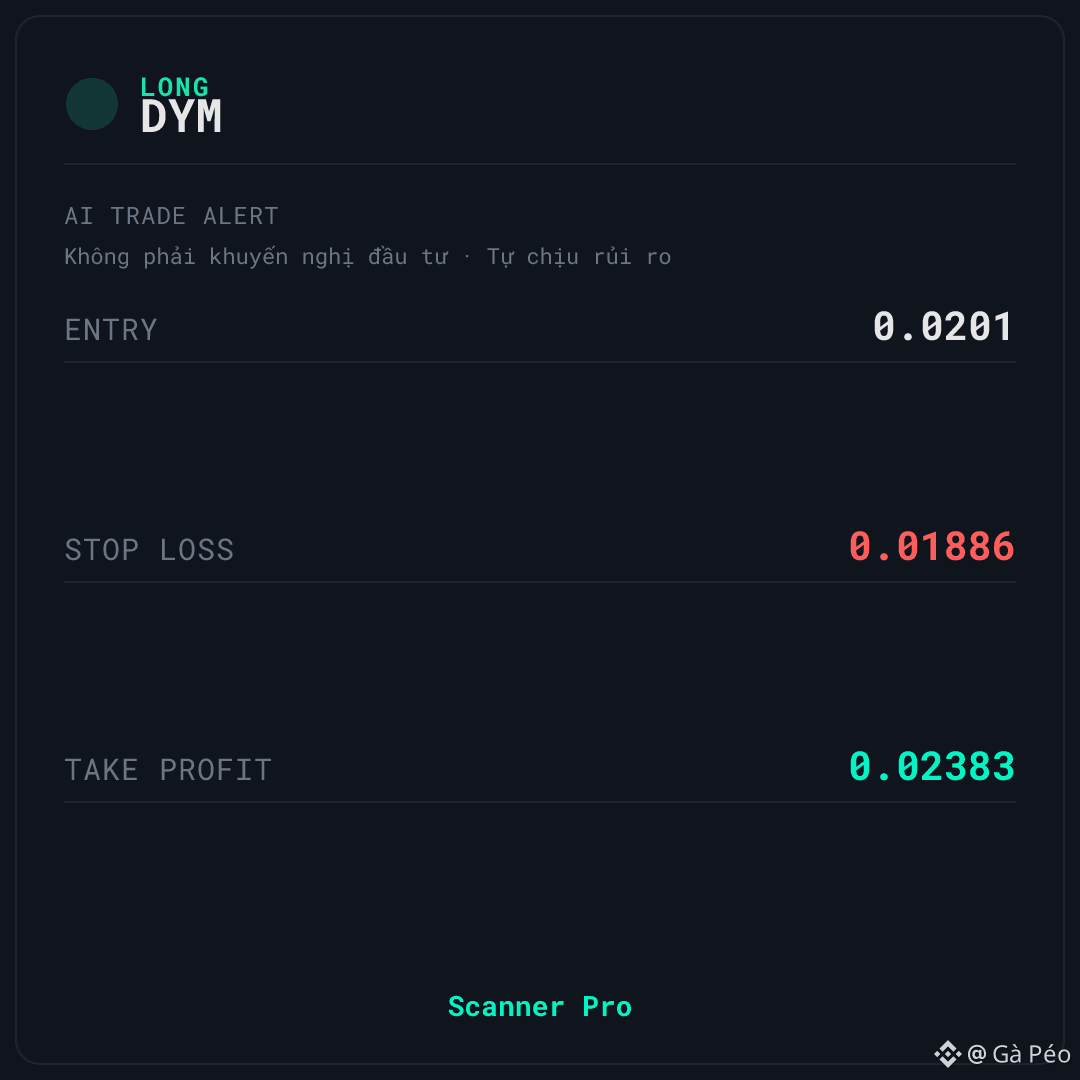
📌 Entry: 0.02007 – 0.02013
🛑 Stop Loss: 0.01886
🎯 Take Profit: 0.02383
⏰ Validity: 6 hours (23:20 on 25/09 – 05:20 on 26/09, VN time)
$DYM is being tracked by Scanner Pro according to the LONG scenario when price holds above the entry zone and the 24h range reaches 14.8%. The backdrop is classified as bullish, but positive funding indicates the LONG side is paying the SHORT side.
📊 WHAT’S HAPPENING NOW
Current price is about 2.7% above the entry zone and sits at 52% of the 24h range—neutral territory, not clearly tilted toward either side. 24h volume is 13,702,981 USDT with a volume spike ratio of 0.16x, meaning liquidity is high but there are no signs of a sudden surge in capital inflow.
Funding 0.0050%: the LONG side is paying the SHORT side. The overall context is bullish and aligns with the direction of the order, but this is a point to watch because the crowd is leaning to the same side.
⚠️ RISKS TO KNOW BEFOREHAND — $DYM
🚫 RSI 1h 62.74 — momentum has heated up; it’s no longer a support area for a buy-entry scenario. Although the backdrop is bullish, this indicator is in the upper half of the neutral zone, leaving less room for further upside.
The biggest disadvantage: the LONG side is crowded and is paying for the SHORT side. When the crowd leans in the same direction as the order, the risk of an upward correction increases—this is a negative factor, not confirmation.
If price closes below the stop-loss level on the signal card, the current LONG scenario is no longer valid.
Do you think this 52% level in the range can hold, or does price still need a deeper retest?
This is educational technical analysis content, not investment advice. Crypto trading carries high risk; you may lose all of your capital. Do your own research and take responsibility for your decisions.
#Binance #Crypto #Futures
🚨 AI TRADE ALERT — $DYM
🟢 LONG
📌 Entry: 0.02007 – 0.02013
🛑 Stop Loss: 0.01886
🎯 Take Profit: 0.02383
⏰ Validity: 6 hours (23:20 on 25/09 – 05:20 on 26/09, VN time)
$DYM is being tracked by Scanner Pro according to the LONG scenario when price holds above the entry zone and the 24h range reaches 14.8%. The backdrop is classified as bullish, but positive funding indicates the LONG side is paying the SHORT side.
📊 WHAT’S HAPPENING NOW
Current price is about 2.7% above the entry zone and sits at 52% of the 24h range—neutral territory, not clearly tilted toward either side. 24h volume is 13,702,981 USDT with a volume spike ratio of 0.16x, meaning liquidity is high but there are no signs of a sudden surge in capital inflow.
Funding 0.0050%: the LONG side is paying the SHORT side. The overall context is bullish and aligns with the direction of the order, but this is a point to watch because the crowd is leaning to the same side.
⚠️ RISKS TO KNOW BEFOREHAND — $DYM
🚫 RSI 1h 62.74 — momentum has heated up; it’s no longer a support area for a buy-entry scenario. Although the backdrop is bullish, this indicator is in the upper half of the neutral zone, leaving less room for further upside.
The biggest disadvantage: the LONG side is crowded and is paying for the SHORT side. When the crowd leans in the same direction as the order, the risk of an upward correction increases—this is a negative factor, not confirmation.
If price closes below the stop-loss level on the signal card, the current LONG scenario is no longer valid.
Do you think this 52% level in the range can hold, or does price still need a deeper retest?
This is educational technical analysis content, not investment advice. Crypto trading carries high risk; you may lose all of your capital. Do your own research and take responsibility for your decisions.
#Binance #Crypto #Futures