📊 TECHNICAL ENTRY DESCRIPTION — ONDO/USDT
🟢 SETUP: BUY ON CONFIRMATION
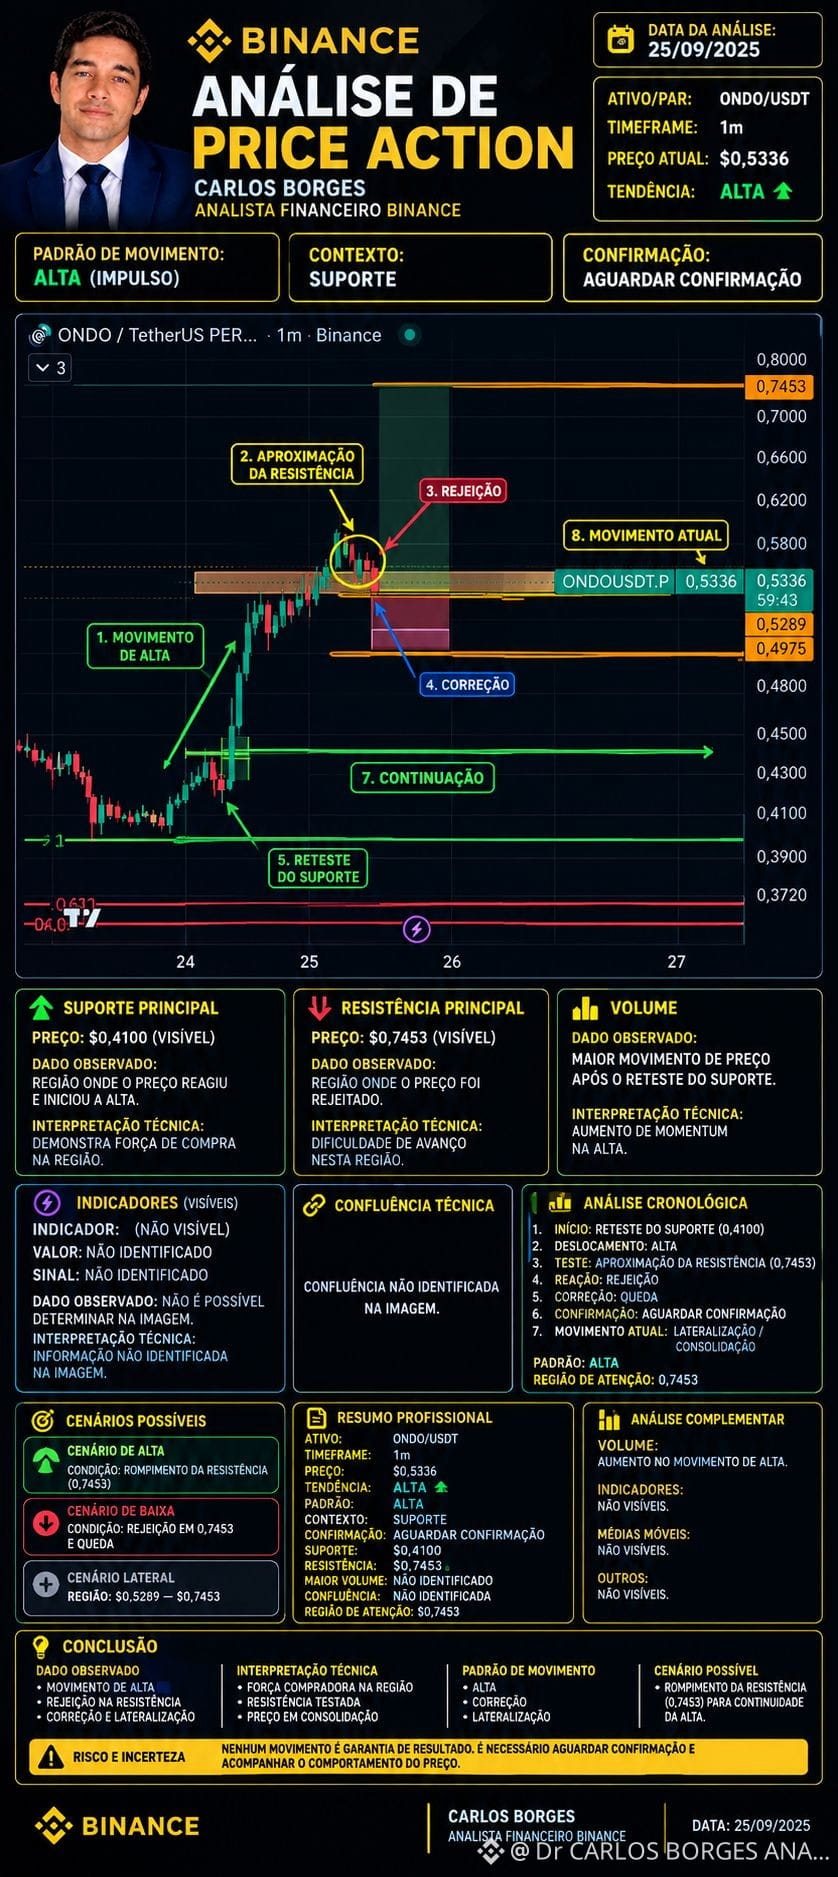
Asset: ONDO/USDT
Timeframe: 1 minute
Observed price: approximately $0,5336
ENTRY REGION: $0,5336
Visible support: $0,5289
Main resistance: $0,7453
📌 Technical reading: the chart shows a strong bullish move followed by correction/consolidation in the $0,53 region. The price is close to the support zone indicated on the chart, but confirmation of a new high is not clearly visible yet.
🎯 Entry trigger: wait for the candle close showing a buying reaction and a rebound above the current region. Without confirmation, do not consider an entry.
🔴 Observed technical invalidation: losing the $0,5289 region increases the risk of the correction continuing toward the $0,4975 region.
🟢 Target/visible resistance: $0,7453, conditioned on confirmation and continuation of the move.
⚠️
🟢 SETUP: BUY ON CONFIRMATION
Asset: ONDO/USDT
Timeframe: 1 minute
Observed price: approximately $0,5336
ENTRY REGION: $0,5336
Visible support: $0,5289
Main resistance: $0,7453
📌 Technical reading: the chart shows a strong bullish move followed by correction/consolidation in the $0,53 region. The price is close to the support zone indicated on the chart, but confirmation of a new high is not clearly visible yet.
🎯 Entry trigger: wait for the candle close showing a buying reaction and a rebound above the current region. Without confirmation, do not consider an entry.
🔴 Observed technical invalidation: losing the $0,5289 region increases the risk of the correction continuing toward the $0,4975 region.
🟢 Target/visible resistance: $0,7453, conditioned on confirmation and continuation of the move.
⚠️