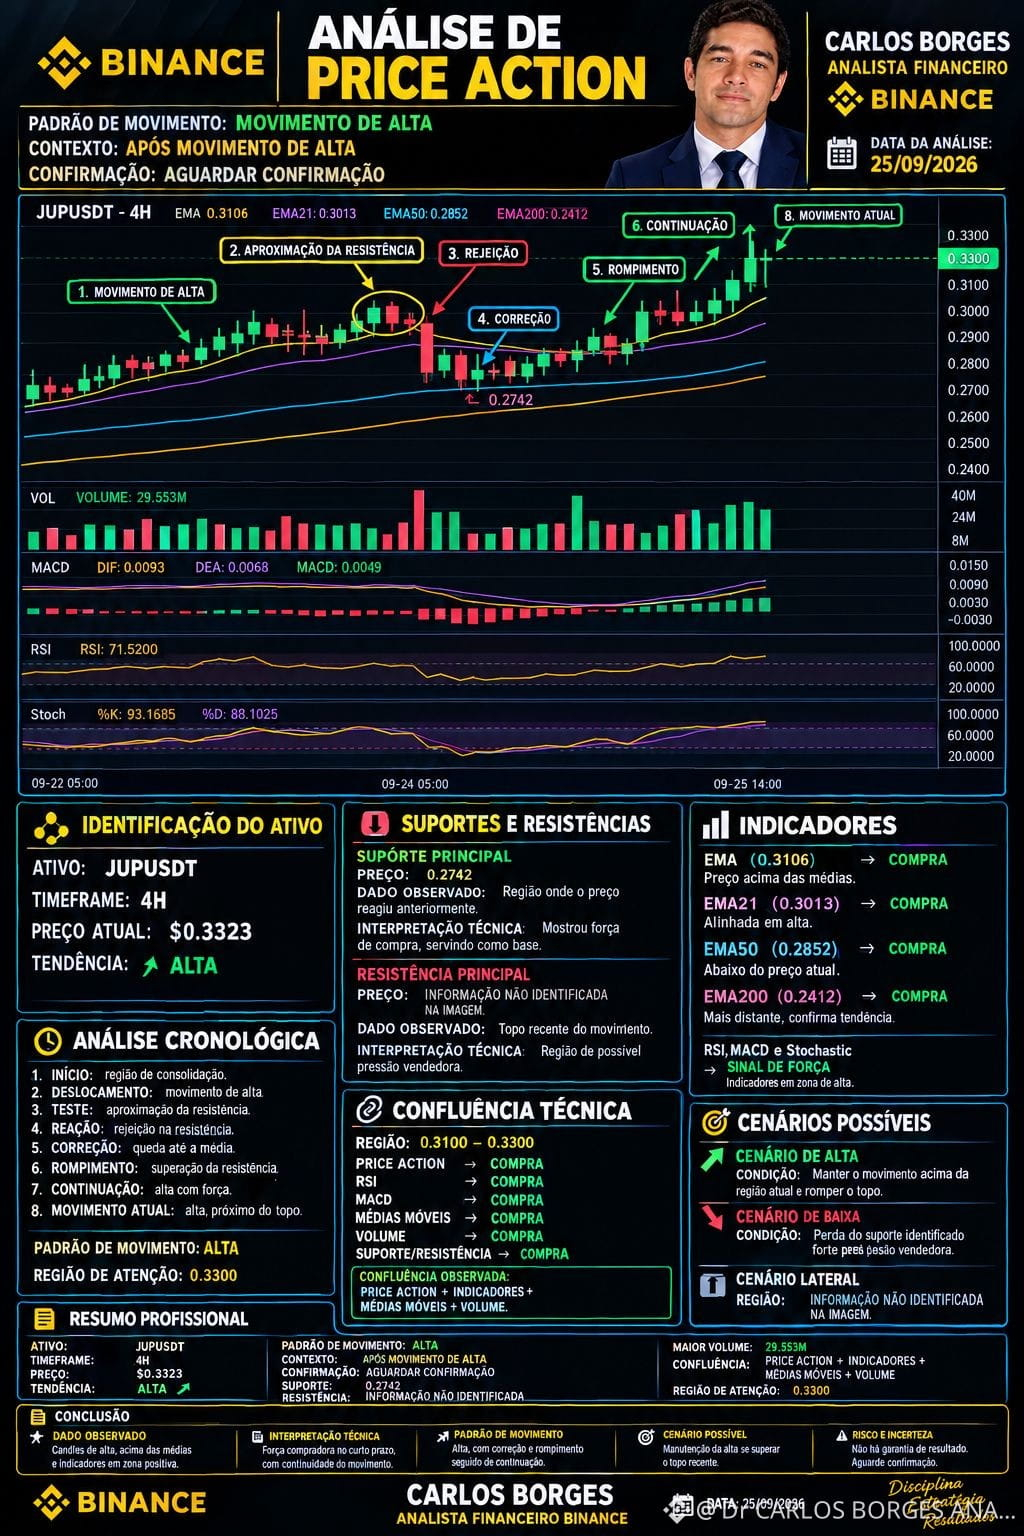
📊 MONITORING — TECHNICAL BUY ANALYSIS | JUPUSDT 4H
🟢 Context: the chart shows an upward movement, with the price above the visible moving averages and a recovery after the 0.2742 region.
📍 Observed price: approximately 0.3323
📍 Attention region: 0,3300
📍 Observed support: 0,2742
🔎 What to monitor
Price staying above 0,3300: check whether the uptrend remains.
Confirmation: wait for the candle to close and for continuation above the attention region before considering a technical confirmation.
Volume: watch if volume stays elevated during any potential continuation of the uptrend.
MACD: it is positive on the chart, with a positive histogram.
RSI: 71,52, indicating strong momentum and also a high zone.
Stochastic: %K 93,17 / %D 88,10, also in a high zone.
Moving averages: EMA9 0,3106, EMA21 0,3013, EMA50 0,2852 and EMA200 0,2412.
⚠️ Risk: oscillators are at elevated levels, so a correction may occur even with the bullish structure. Do not treat the move as a guarantee.
📌 MONITORING:
JUPUSDT 4H — POSSIBLE CONTINUATION OF AN UPTREND. WAIT FOR PRICE CONFIRMATION ABOVE THE 0,3300 REGION AND WATCH VOLUME AND THE CLOSES OF THE UPCOMING CANDLES.
CARLOS BORGES — BINANCE FINANCIAL ANALYST
🟢 Context: the chart shows an upward movement, with the price above the visible moving averages and a recovery after the 0.2742 region.
📍 Observed price: approximately 0.3323
📍 Attention region: 0,3300
📍 Observed support: 0,2742
🔎 What to monitor
Price staying above 0,3300: check whether the uptrend remains.
Confirmation: wait for the candle to close and for continuation above the attention region before considering a technical confirmation.
Volume: watch if volume stays elevated during any potential continuation of the uptrend.
MACD: it is positive on the chart, with a positive histogram.
RSI: 71,52, indicating strong momentum and also a high zone.
Stochastic: %K 93,17 / %D 88,10, also in a high zone.
Moving averages: EMA9 0,3106, EMA21 0,3013, EMA50 0,2852 and EMA200 0,2412.
⚠️ Risk: oscillators are at elevated levels, so a correction may occur even with the bullish structure. Do not treat the move as a guarantee.
📌 MONITORING:
JUPUSDT 4H — POSSIBLE CONTINUATION OF AN UPTREND. WAIT FOR PRICE CONFIRMATION ABOVE THE 0,3300 REGION AND WATCH VOLUME AND THE CLOSES OF THE UPCOMING CANDLES.
CARLOS BORGES — BINANCE FINANCIAL ANALYST