📊 TECHNICAL MONITORING — ONDOUSDT | 4H
🟢 BUY SCENARIO UNDER MONITORING
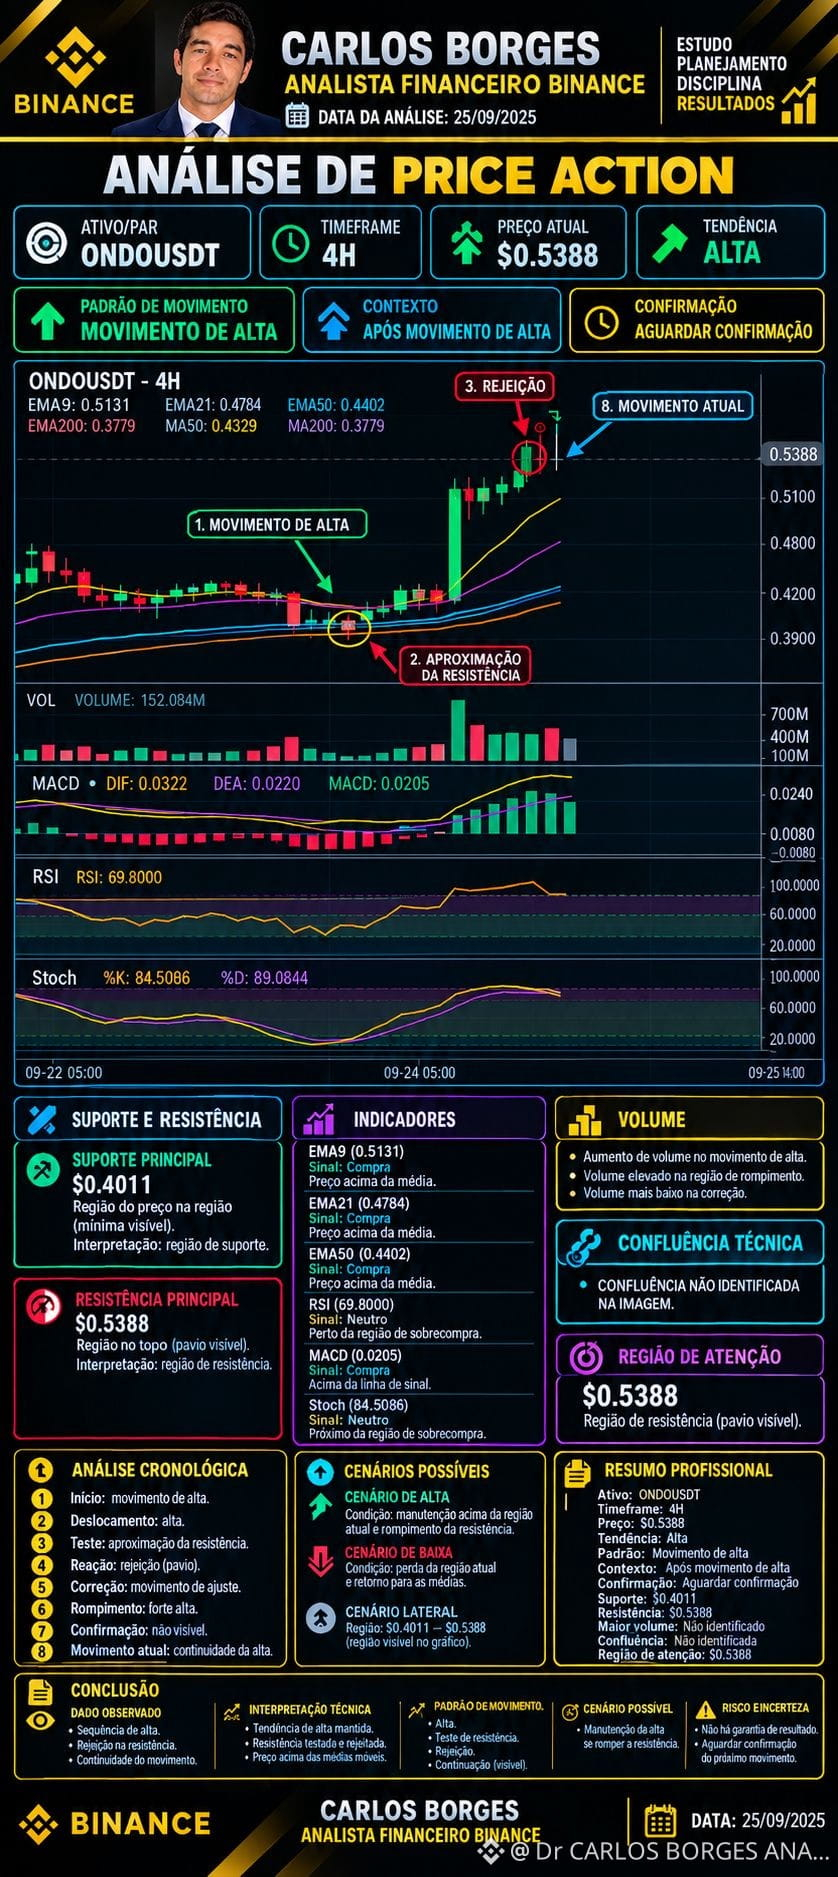
ONDOUSDT shows a clearly visible high structure, with the price at US$ 0,5388, above the averages displayed on the chart. The recent move had a strong bullish displacement and increased volume.
Follow-up points:
Resistance: US$ 0,5388 — region currently being tested by the price.
Visual Support: region of US$ 0,4011.
EMA 9: 0,5131
EMA 21: 0,4784
EMA 50: 0,4402
EMA 200: 0,3779
RSI: 69,80 — close to the overbought area.
MACD: 0,0205, with a visible positive histogram.
Stoch: %K 84,51 / %D 89,08 — elevated area.
Volume: 152,084M on the panel; there was an increase in volume during the strong bullish move.
🎯 MONITORING
Buy: follow only if there is favorable price behavior after testing the region of US$ 0,5388.
Confirmation: wait for a close/continuation above resistance or another clearly visible confirmation on the chart.
Correction: if the price pulls back, observe the reaction in the moving averages and support regions before considering continuation.
Loss of strength: be alert if stronger rejection appears in the region of US$ 0,5388 along with a deterioration of the indicators.
⚠️
🟢 BUY SCENARIO UNDER MONITORING
ONDOUSDT shows a clearly visible high structure, with the price at US$ 0,5388, above the averages displayed on the chart. The recent move had a strong bullish displacement and increased volume.
Follow-up points:
Resistance: US$ 0,5388 — region currently being tested by the price.
Visual Support: region of US$ 0,4011.
EMA 9: 0,5131
EMA 21: 0,4784
EMA 50: 0,4402
EMA 200: 0,3779
RSI: 69,80 — close to the overbought area.
MACD: 0,0205, with a visible positive histogram.
Stoch: %K 84,51 / %D 89,08 — elevated area.
Volume: 152,084M on the panel; there was an increase in volume during the strong bullish move.
🎯 MONITORING
Buy: follow only if there is favorable price behavior after testing the region of US$ 0,5388.
Confirmation: wait for a close/continuation above resistance or another clearly visible confirmation on the chart.
Correction: if the price pulls back, observe the reaction in the moving averages and support regions before considering continuation.
Loss of strength: be alert if stronger rejection appears in the region of US$ 0,5388 along with a deterioration of the indicators.
⚠️