

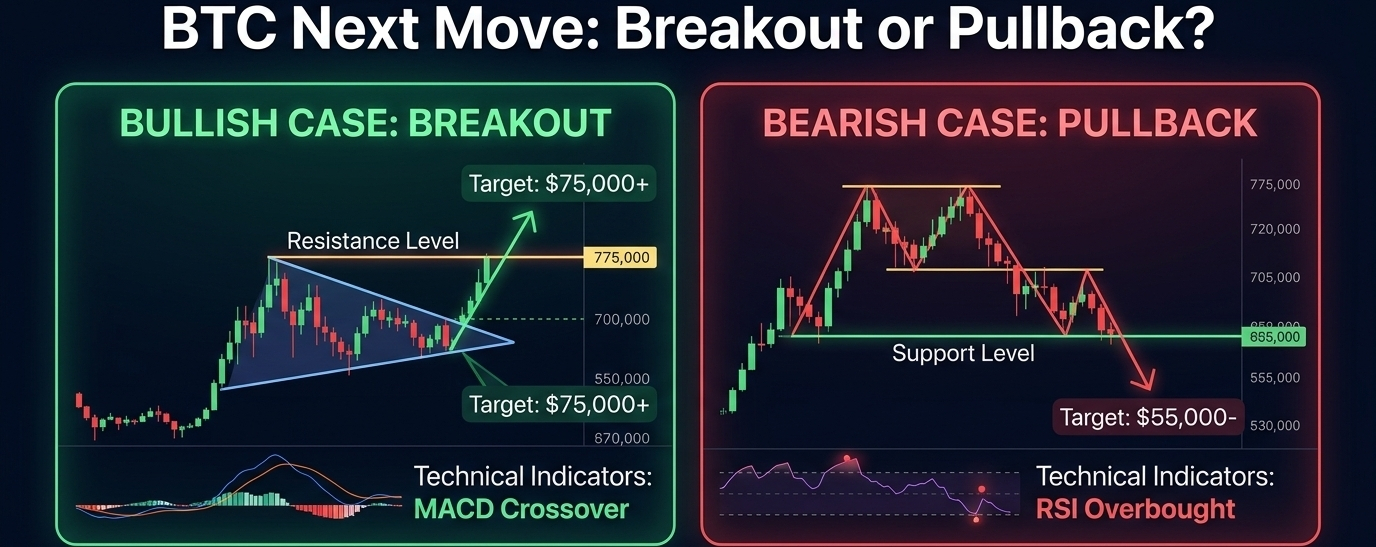


Bitcoin ($BTC) is testing key levels around $85,000 – $86,500 after expanding out of its lower consolidation channels.
📈 Market Structure Analysis
Trend Bias: Bullish across Daily, 4H, and 1H timeframes. All major Exponential Moving Averages (20 EMA, 50 EMA, 200 EMA) are stacked in upward alignment.
Current State: Overextended in the short term. Daily RSI sits near 71–72, while short-term 1H/15m RSIs have touched 80–86. A short-term consolidation or shallow pullback is normal before any sustained breakout continuation.
Key Price Levels Traders Must Watch
[ $90,000 Major Psychological Target ]
│
[ $86,500 - $87,000 Breakout Resistance Zone ]
──────────────────────── CURRENT RANGE ($84,500 - $85,500) ────────────────────────
│
[ $82,800 - $83,700 Immediate Support (Pivot Zone) ]
│
[ $78,600 - $80,000 Major Trend Support (20 EMA) ]. Resistance Levels (Breakout Targets)
$85,600 – $86,500 (Immediate Resistance Zone): The main upper structural barrier. A clean daily candle close above $86,500 with strong spot volume confirms a continuation towards higher highs.
$90,000 – $90,600 (Macro Expansion Target): The next psychological magnet if $86.5K breaks convincingly.
2. Support Levels (Pullback & Buy Zones)
$83,700 – $84,000 (Immediate Support / Former Resistance): The key local pivot. Holding above this zone preserves aggressive short-term bullish momentum.
$82,100 – $82,800 (Primary Retest Zone): The high-volume demand node. A healthy pullback to this zone would cool down overbought indicators while maintaining the overall uptrend structure.
$78,600 (Trend Invalidation Zone): Aligns with the 20-day EMA. Losing this level on a daily close would invalidate the immediate breakout setup and shift bias back to neutral/bearish.
(Disclaimer: Technical analysis and educational market breakdowns are for informational purposes only and do not constitute financial advice. Always manage risk carefully with stop-losses.)