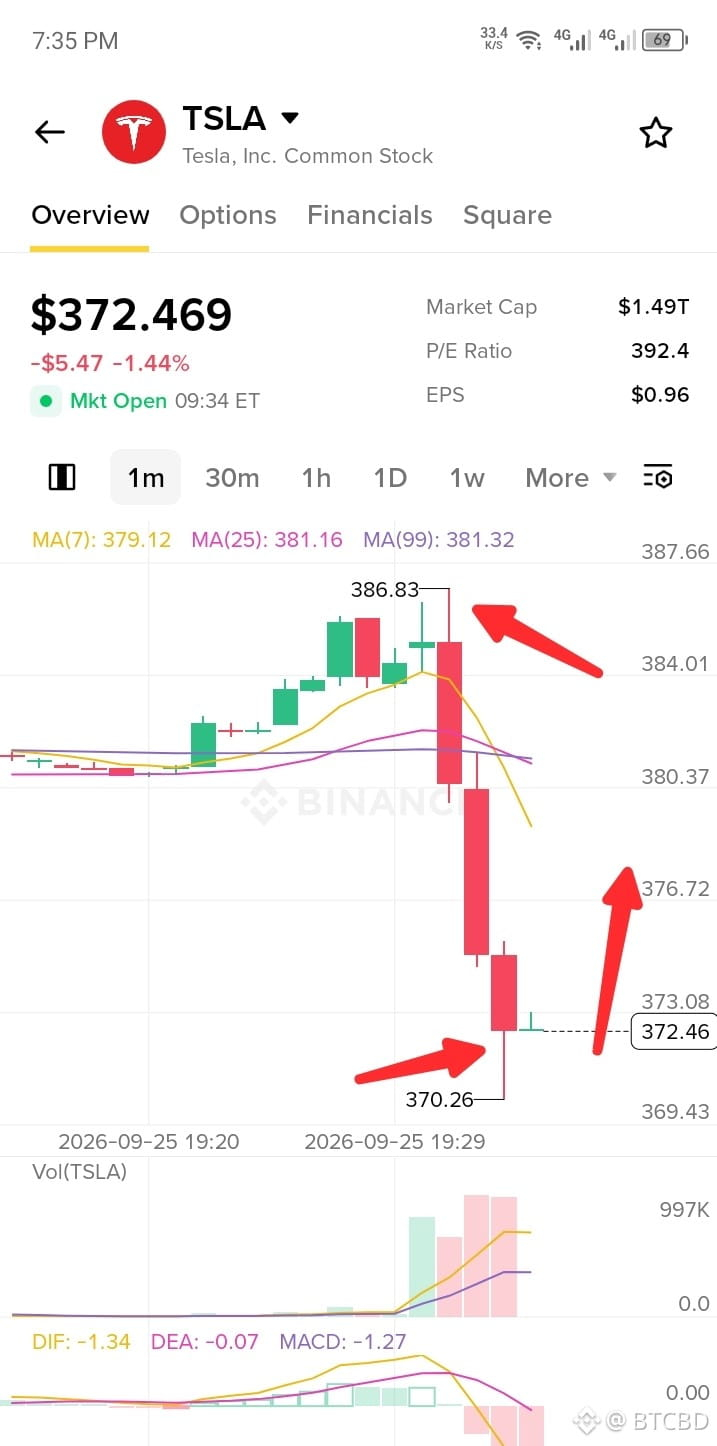
📌 TSLA 1m Chart Analysis: Bounce Back or Further Drop? 📉📈
Tesla ($TSLA) experienced a sharp drop on the 1-minute chart, dumping from $386.83 down to hit a low of $370.26.
🔑 Key Levels:
• Support: $370.26
• Resistance: $379.10 - $381.30
• Current Price: ~$372.46
💡 Market Outlook:
• Short-Term Bounce (UP): The $370.26 level is acting as a strong temporary support. A quick relief bounce toward $375–$378 is likely.
• Downside Risk (DOWN): If it breaks below $370.26, expect further downside toward $368.
⚠️ Strategy: Look for a short scalping opportunity on the bounce, but keep tight Stop Loss as overall momentum remains bearish.
#TSLA $TRX
Tesla ($TSLA) experienced a sharp drop on the 1-minute chart, dumping from $386.83 down to hit a low of $370.26.
🔑 Key Levels:
• Support: $370.26
• Resistance: $379.10 - $381.30
• Current Price: ~$372.46
💡 Market Outlook:
• Short-Term Bounce (UP): The $370.26 level is acting as a strong temporary support. A quick relief bounce toward $375–$378 is likely.
• Downside Risk (DOWN): If it breaks below $370.26, expect further downside toward $368.
⚠️ Strategy: Look for a short scalping opportunity on the bounce, but keep tight Stop Loss as overall momentum remains bearish.
#TSLA $TRX