🚨 FIBONACCI CODE: The mathematical secret behind Solana’s trap at $120 🐋📐
Solana hit highs of $122.33 and suddenly stalled. Many retail traders see a simple consolidation to keep pushing higher, but market geometry reveals a very different institutional recharge structure.
📐 THE FIBONACCI X-RAY (The map of smart money):
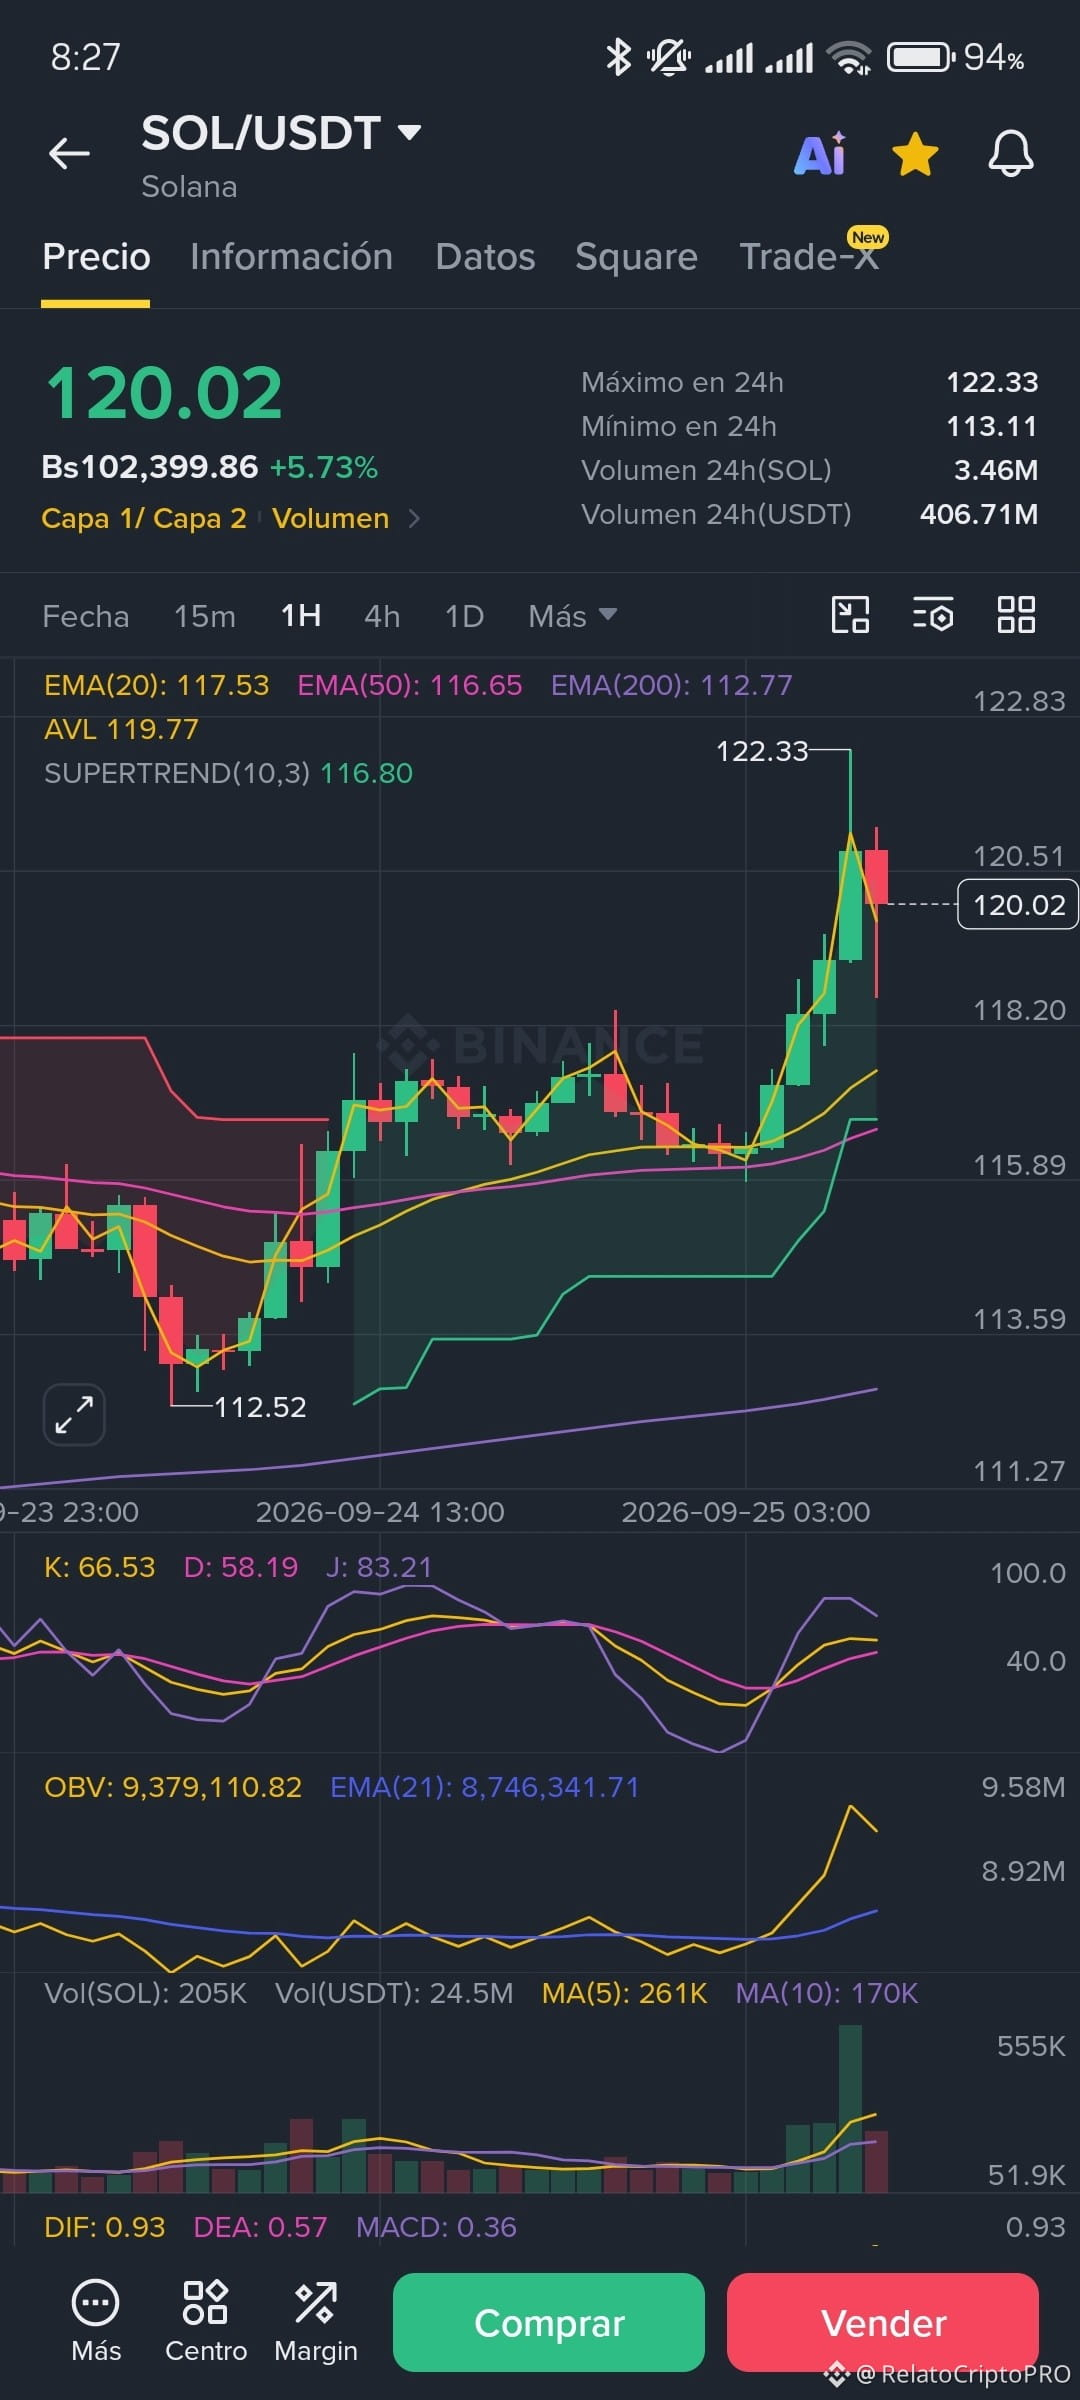
By drawing the Fibonacci retracement tool from the start of the impulse at $112.52 to the peak at $122.33, the algorithm lays bare the market’s intentions:
Crystal Support (23.6%): The current price at $120.02 is making a precise equilibrium on the first Fibonacci level (23.6% = $120.01). Technical explanation: This is a trap level. It lures anxious buyers with FOMO, but it lacks the structural strength to sustain a massive rebound after such a vertical climb.
The “Golden Pocket” (50% and 61.8%): The whales’ real networks wait lower. The 50% mathematical retracement sets a target of $117.42. The data’s magic? That price aligns exactly with our main dynamic support, the 20 EMA on 1H at $117.53. Further down, the 61.8% aligns millimeter-perfectly with the 50 EMA at $116.65.
📊 INDICATORS (Why the correction is imminent):
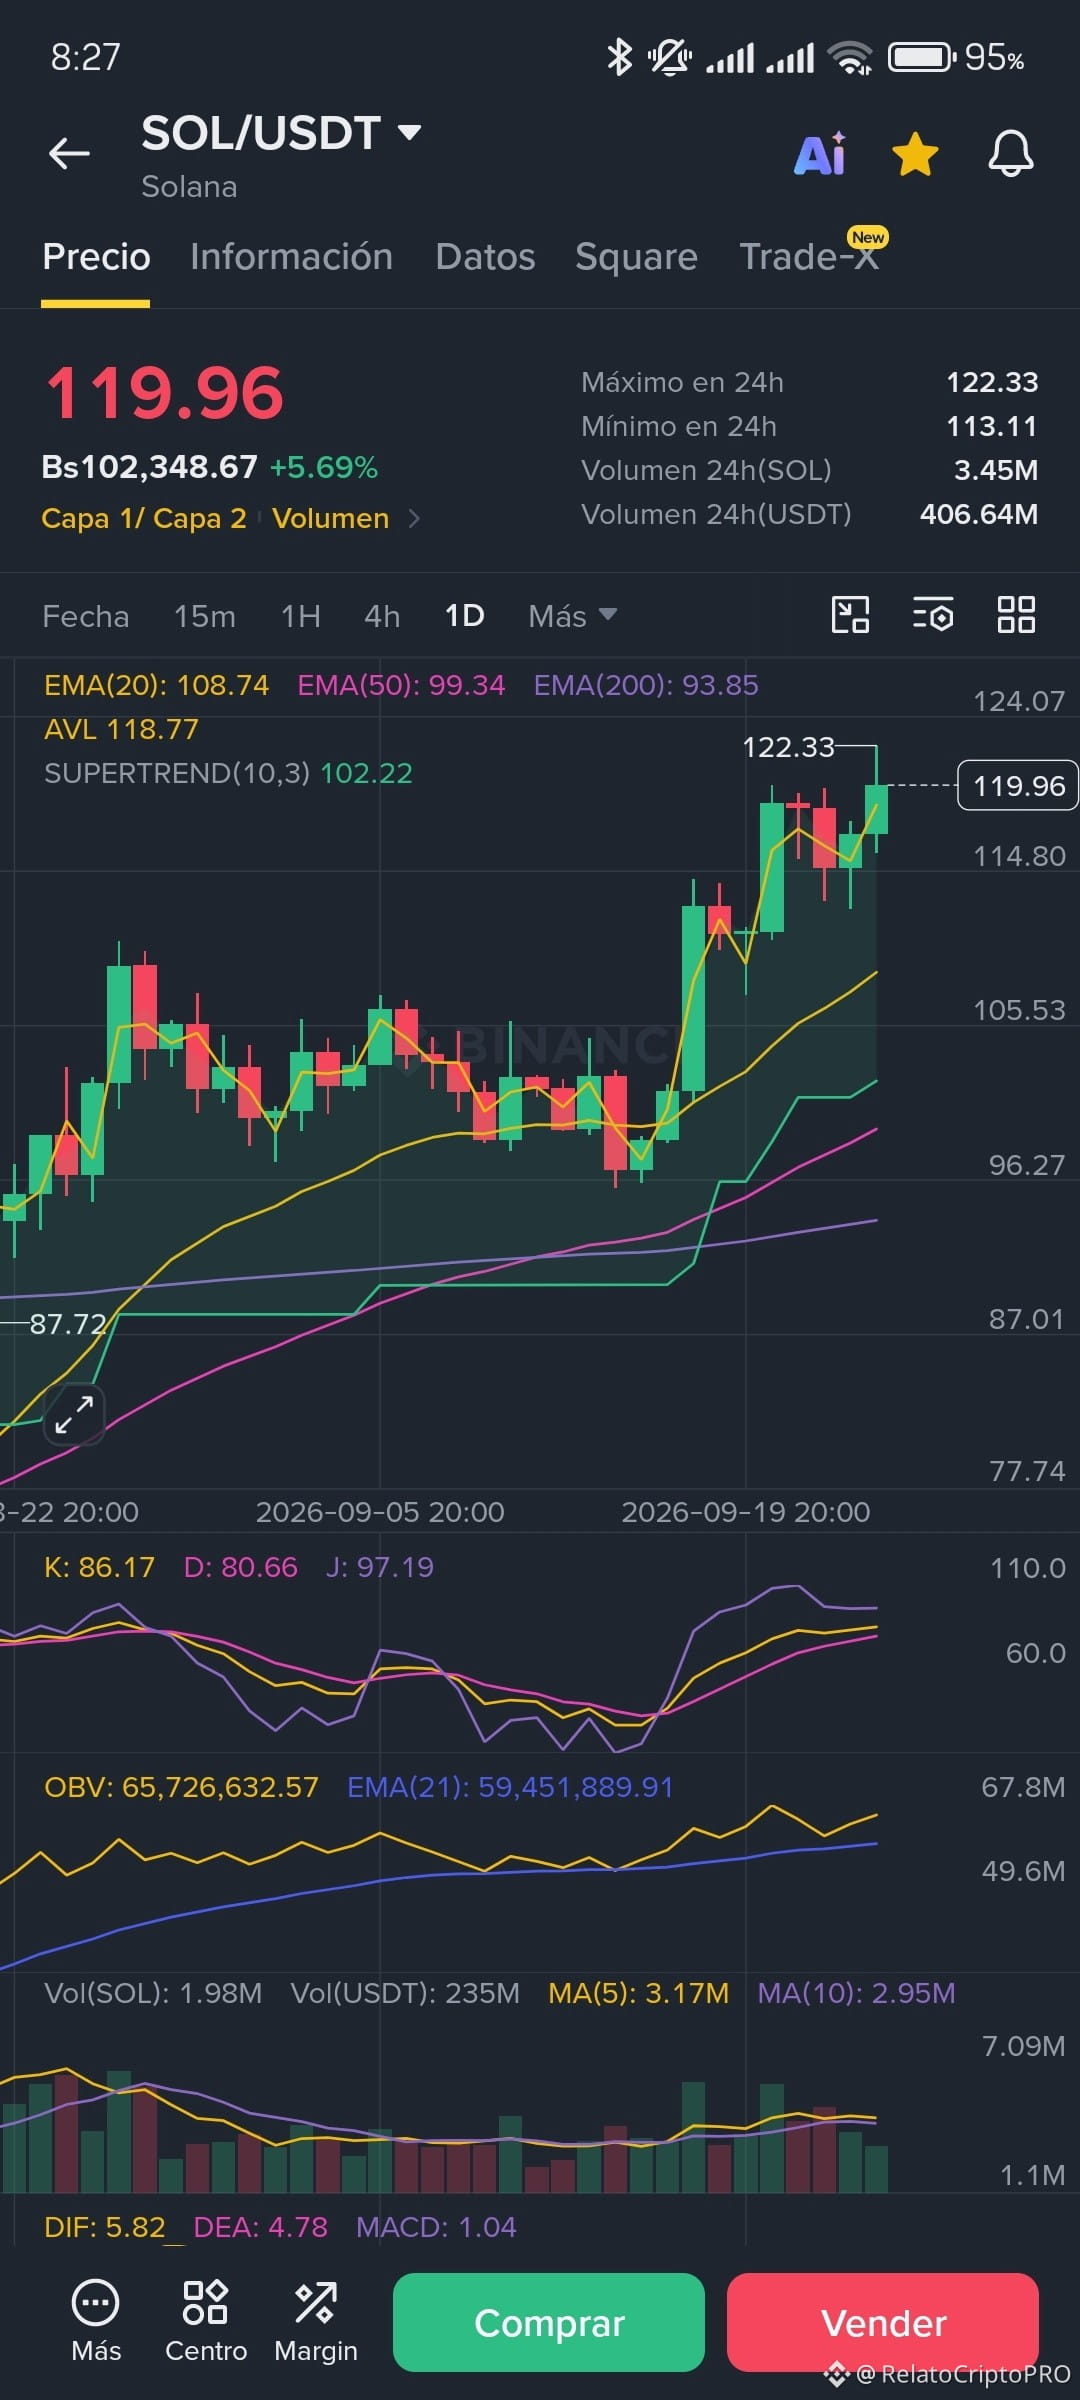
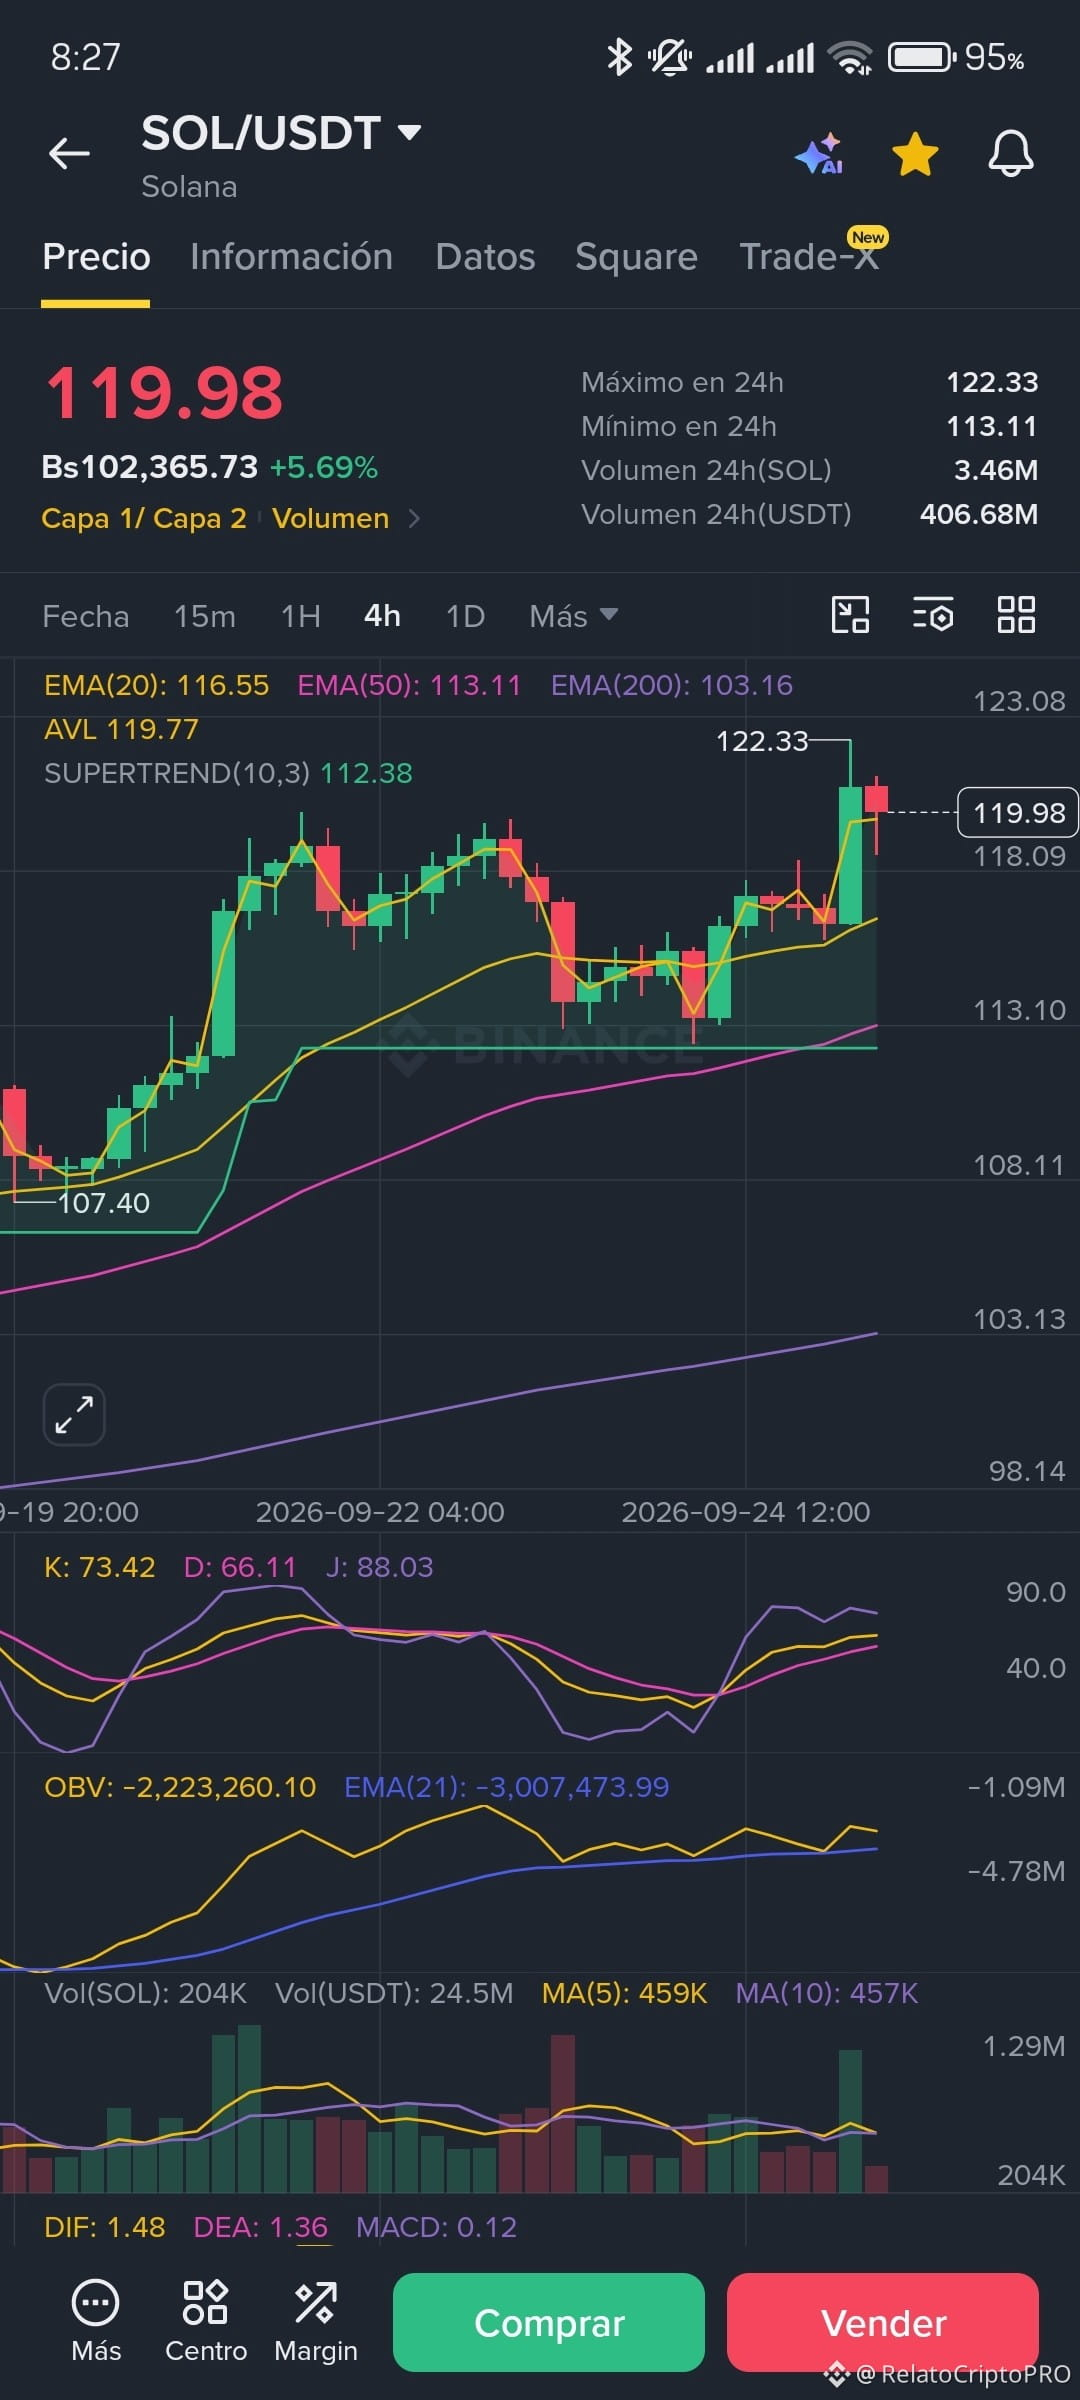
Suffocation in the Engine (KDJ): The impulse burned all the fuel. The daily KDJ is in extreme overbought with a 'J' at 97.19, while on 4H it hovers around 88.03. The market demands this excess be purged before attempting to reach for $125.
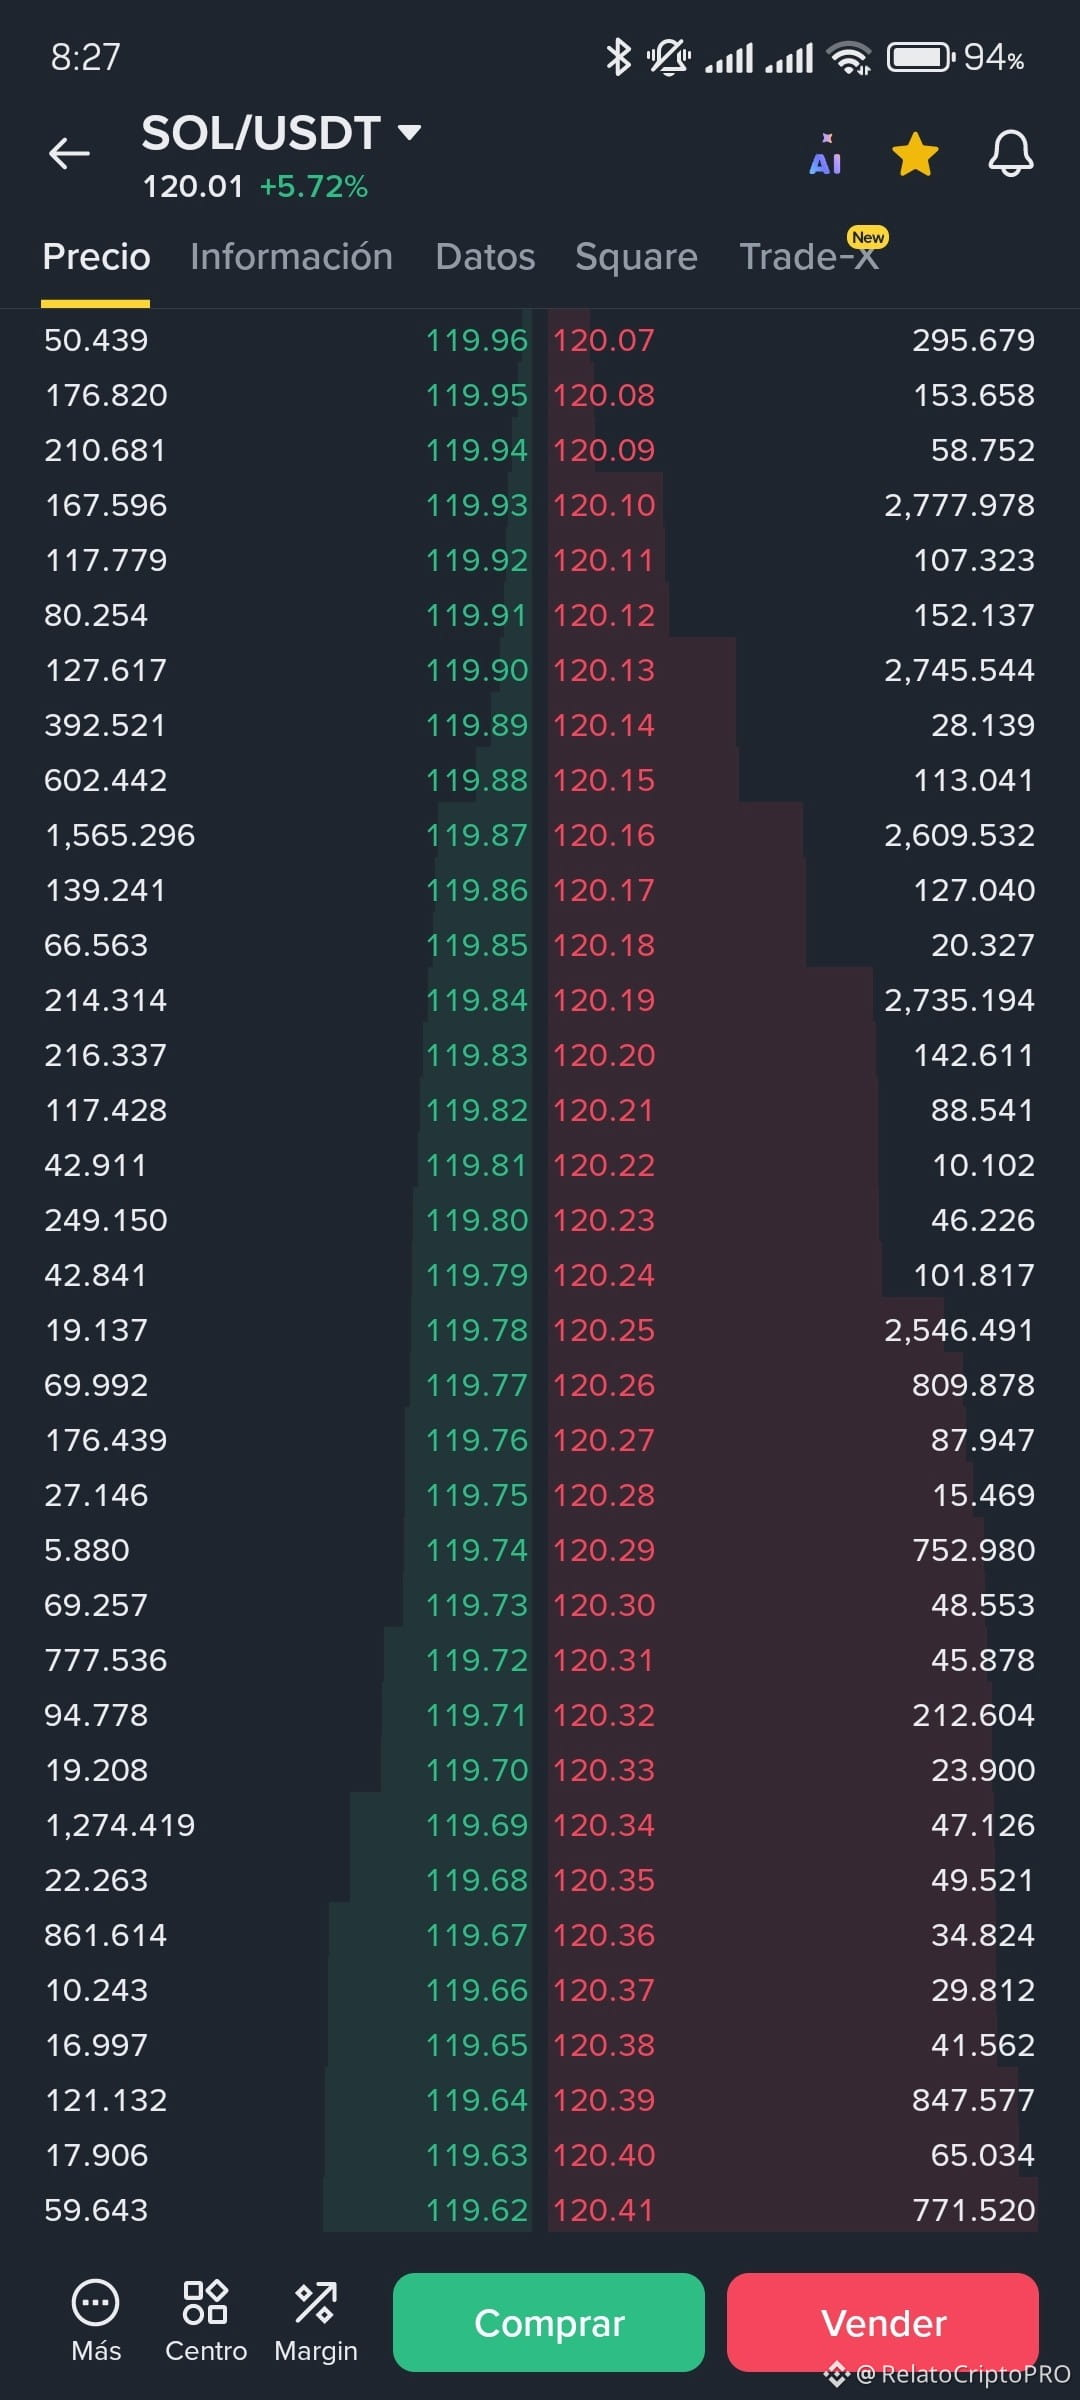
Containment Wall (Order Book): The whales put up a wall of over 10,000 SOL starting at $120.10. They’re holding the price up to force the drain toward their buy orders in the lower Fibonacci zone.
♟️ THE SNIPER SETUP:
🔴 SNIPER SETUP:
🔴 Error: Buying at $120, assuming a definitive floor.
🟢 Hunting Zone: Mathematical patience. The networks are waiting at the confluence: $116.65 - $117.53.
FOMO buys at resistance; statistics buy at Fibonacci.
Solana hit highs of $122.33 and suddenly stalled. Many retail traders see a simple consolidation to keep pushing higher, but market geometry reveals a very different institutional recharge structure.
📐 THE FIBONACCI X-RAY (The map of smart money):
By drawing the Fibonacci retracement tool from the start of the impulse at $112.52 to the peak at $122.33, the algorithm lays bare the market’s intentions:
Crystal Support (23.6%): The current price at $120.02 is making a precise equilibrium on the first Fibonacci level (23.6% = $120.01). Technical explanation: This is a trap level. It lures anxious buyers with FOMO, but it lacks the structural strength to sustain a massive rebound after such a vertical climb.
The “Golden Pocket” (50% and 61.8%): The whales’ real networks wait lower. The 50% mathematical retracement sets a target of $117.42. The data’s magic? That price aligns exactly with our main dynamic support, the 20 EMA on 1H at $117.53. Further down, the 61.8% aligns millimeter-perfectly with the 50 EMA at $116.65.
📊 INDICATORS (Why the correction is imminent):
Suffocation in the Engine (KDJ): The impulse burned all the fuel. The daily KDJ is in extreme overbought with a 'J' at 97.19, while on 4H it hovers around 88.03. The market demands this excess be purged before attempting to reach for $125.
Containment Wall (Order Book): The whales put up a wall of over 10,000 SOL starting at $120.10. They’re holding the price up to force the drain toward their buy orders in the lower Fibonacci zone.
♟️ THE SNIPER SETUP:
🔴 SNIPER SETUP:
🔴 Error: Buying at $120, assuming a definitive floor.
🟢 Hunting Zone: Mathematical patience. The networks are waiting at the confluence: $116.65 - $117.53.
FOMO buys at resistance; statistics buy at Fibonacci.