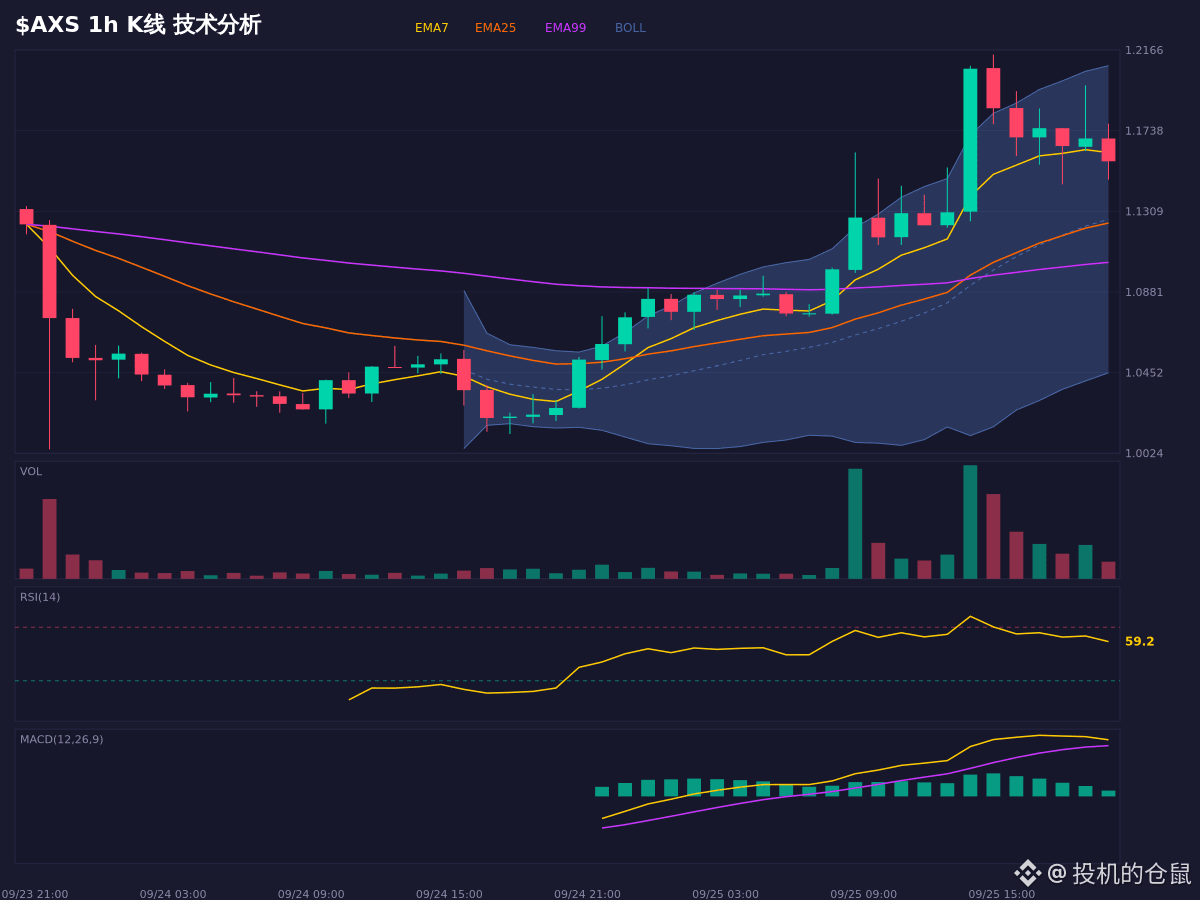
$AXS This rally appears strong on the surface, but there are hidden variables.
The moving-average bull alignment looks great, but the MACD histogram has started to shrink—no need to say more: the upward momentum is already weakening. Even more striking is the Stoch RSI death cross; the short-term indicators have begun to turn, contradicting the overall trend.
The OBV volume flow suggests that money is flowing out. After this upswing, volume has not kept up—so be careful. The current price is right below the EMA7, which is a key level.
If price can find support in the 1.1171~1.1400 range and hold, the bullish structure may continue. But if it breaks below 1.0942, the current long-side logic is basically invalidated. The resistance levels overhead are 1.2118 and 1.2577; if you want to push higher, you’ll need to break through those areas first.
For chart observation and scenario planning only; it does not constitute a trading action record.
$AXS #牛市 #合约 #spot
The moving-average bull alignment looks great, but the MACD histogram has started to shrink—no need to say more: the upward momentum is already weakening. Even more striking is the Stoch RSI death cross; the short-term indicators have begun to turn, contradicting the overall trend.
The OBV volume flow suggests that money is flowing out. After this upswing, volume has not kept up—so be careful. The current price is right below the EMA7, which is a key level.
If price can find support in the 1.1171~1.1400 range and hold, the bullish structure may continue. But if it breaks below 1.0942, the current long-side logic is basically invalidated. The resistance levels overhead are 1.2118 and 1.2577; if you want to push higher, you’ll need to break through those areas first.
For chart observation and scenario planning only; it does not constitute a trading action record.
$AXS #牛市 #合约 #spot