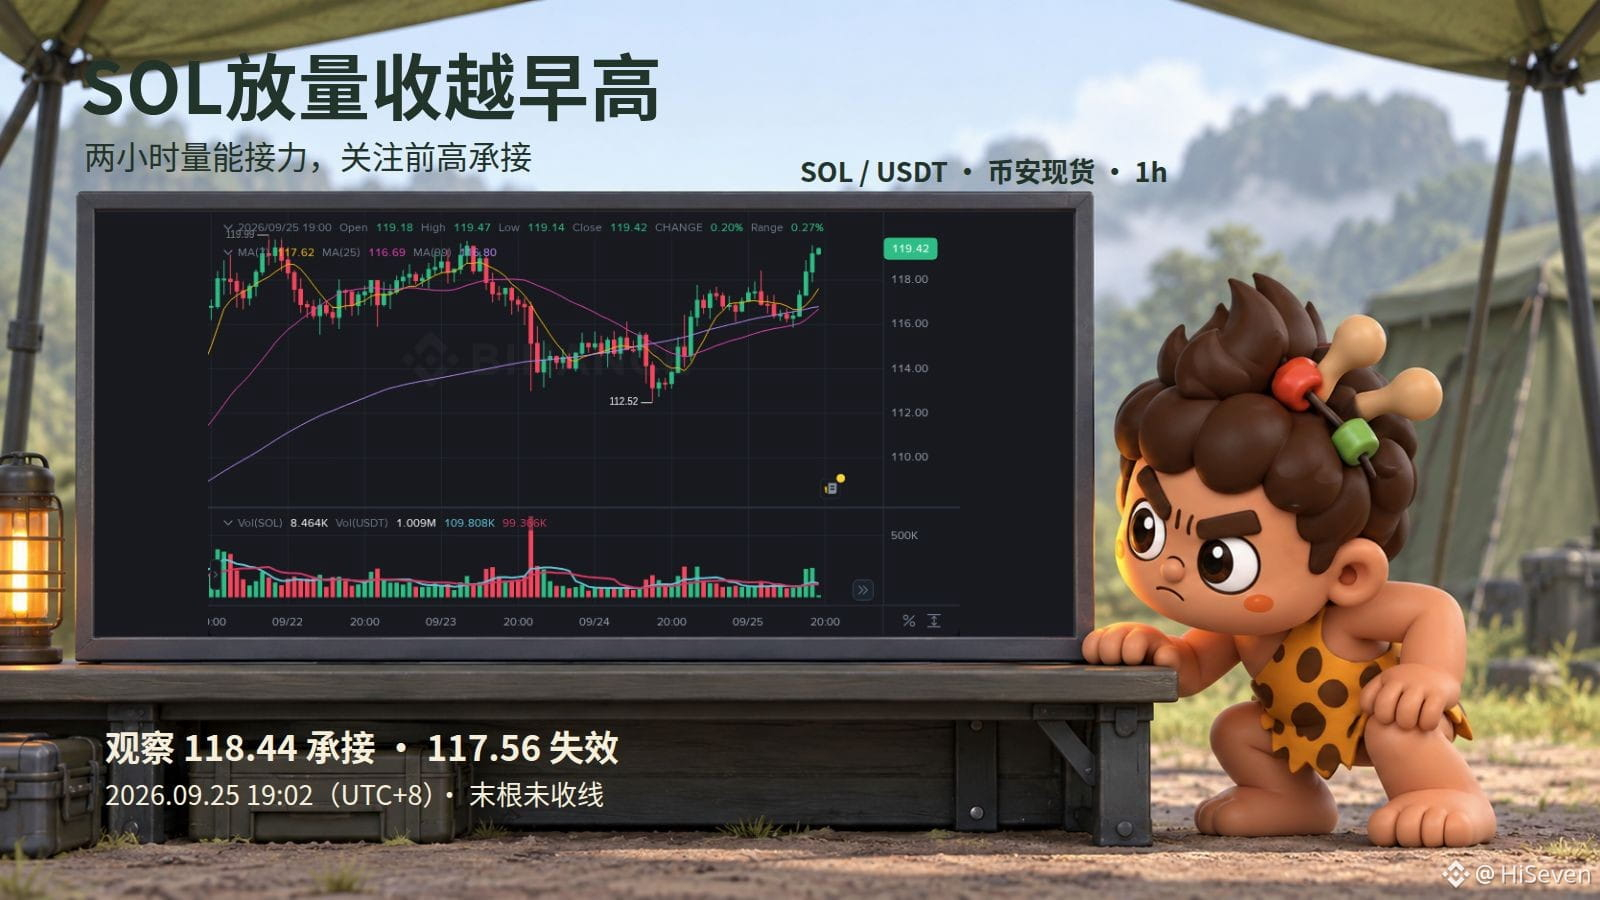

$SOL Breakout volume surpassed the early morning high sooner than expected. Among the mainstream coins, this is worth keeping an eye on for the next leg upward. The reason to watch with a slightly bullish bias is that the hourly closing price has finally crossed above the spot where the morning spike and pullback occurred.
On Binance spot, at 10:00 it touched 118.44 then closed lower; at 17:00 it surged again but still closed below that level; only at 18:00 did it close up to 119.18. After two tests of the high, the breakout is confirmed by a closing price break—this provides an extra layer of validation compared with only looking at intraday price increases.
Volume also picked up: the volume at 17:00 was 2.58 times that at 16:00. And it didn’t fade back at 18:00—it added about another 4%. This is an expansion in traded volume, which doesn’t necessarily mean net inflows.
Next, watch whether 118.44 can turn from the previous high into a support/resistance pivot that gets accepted and held. After backtesting, only if hourly closes continue to hold above it should you look for continuation; if it closes back below the 16:00 high of 117.56, then this breakout observation is invalidated. Chasing right after a sudden rise often runs into profit-taking pullbacks.
You can open the SOL spot 1-hour chart and track the next retest. Don’t treat the unclosed 19:00 candle as confirmation.
Source: Binance SOL/USDT spot, Sep 25 at 19:02 (UTC+8).
https://www.binance.com/en/trade/SOL_USDT?type=spot
On Binance spot, at 10:00 it touched 118.44 then closed lower; at 17:00 it surged again but still closed below that level; only at 18:00 did it close up to 119.18. After two tests of the high, the breakout is confirmed by a closing price break—this provides an extra layer of validation compared with only looking at intraday price increases.
Volume also picked up: the volume at 17:00 was 2.58 times that at 16:00. And it didn’t fade back at 18:00—it added about another 4%. This is an expansion in traded volume, which doesn’t necessarily mean net inflows.
Next, watch whether 118.44 can turn from the previous high into a support/resistance pivot that gets accepted and held. After backtesting, only if hourly closes continue to hold above it should you look for continuation; if it closes back below the 16:00 high of 117.56, then this breakout observation is invalidated. Chasing right after a sudden rise often runs into profit-taking pullbacks.
You can open the SOL spot 1-hour chart and track the next retest. Don’t treat the unclosed 19:00 candle as confirmation.
Source: Binance SOL/USDT spot, Sep 25 at 19:02 (UTC+8).
https://www.binance.com/en/trade/SOL_USDT?type=spot