ICP This move is kind of interesting.
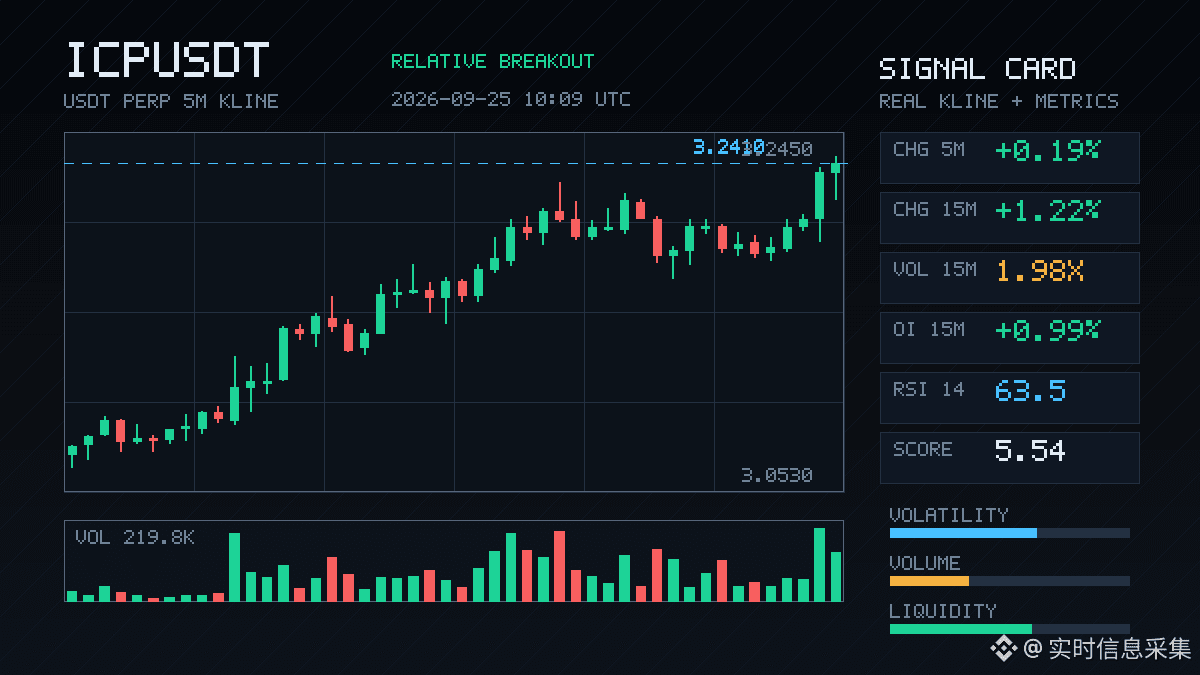
In the 15m timeframe, it’s up 1.22%. It doesn’t look like much, but the volume directly hit 1.98x. The Z value is 2.44—this isn’t the sort of volume a retail crowd casually taps twice. The candle closes by breaking above the upper edge of the recent 5m range of nearly 20 bars. Active trading difference is 12.5%, and the buy/sell ratio is 1.29—clearly, there’s money actively sweeping.
More importantly, OI—15m +0.99%, 1h +0.55%. The combined notional change is over 1 million U. Price is rising while OI is also rising, which suggests it’s not short-covering pushing the move; it looks like new leveraged long positions are entering. OI percentile is 97.8%, rank #3 in the whole pool, and notional change rank #15. These abnormal patterns continuing across multiple consecutive cycles usually aren’t noise.
In the last 24h, trading value is 58.88M. Liquidity is sufficient—this isn’t a chart where someone just pokes a single wick and runs.
With price near historical extreme zones and abnormalities ranking near the top in the whole pool, I’ll keep an eye on whether it can hold above this 5m upper edge. If it can’t hold, it’ll likely be a fake breakout; if it can hold, there may be another leg up. Not financial advice—judge for yourself.
In the 15m timeframe, it’s up 1.22%. It doesn’t look like much, but the volume directly hit 1.98x. The Z value is 2.44—this isn’t the sort of volume a retail crowd casually taps twice. The candle closes by breaking above the upper edge of the recent 5m range of nearly 20 bars. Active trading difference is 12.5%, and the buy/sell ratio is 1.29—clearly, there’s money actively sweeping.
More importantly, OI—15m +0.99%, 1h +0.55%. The combined notional change is over 1 million U. Price is rising while OI is also rising, which suggests it’s not short-covering pushing the move; it looks like new leveraged long positions are entering. OI percentile is 97.8%, rank #3 in the whole pool, and notional change rank #15. These abnormal patterns continuing across multiple consecutive cycles usually aren’t noise.
In the last 24h, trading value is 58.88M. Liquidity is sufficient—this isn’t a chart where someone just pokes a single wick and runs.
With price near historical extreme zones and abnormalities ranking near the top in the whole pool, I’ll keep an eye on whether it can hold above this 5m upper edge. If it can’t hold, it’ll likely be a fake breakout; if it can hold, there may be another leg up. Not financial advice—judge for yourself.