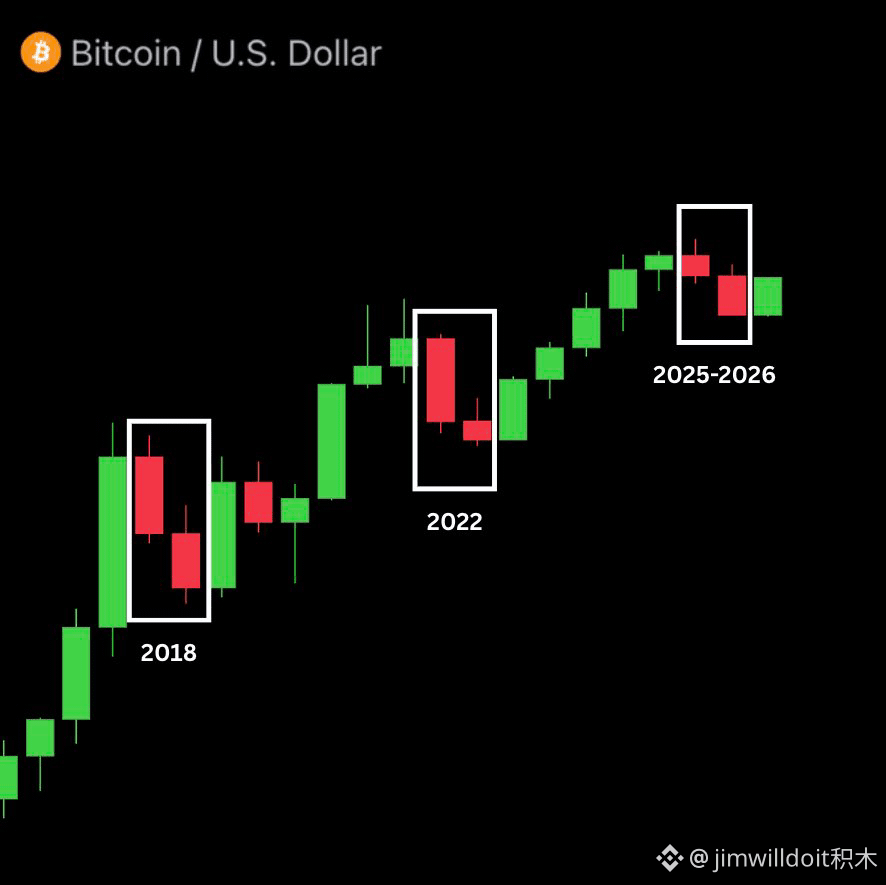
$BTC The half-year reversal signal is back again!
In the past two bear markets, half-year moving average candles turned negative only twice.
But afterward, a strong green half-year moving average period followed!
More importantly, a new upward trend was launched right after that.
Now a similar historical pattern is once again right in front of us!
From the perspective of the half-year K-line, during the bear phases of the past two cycles, BTC experienced major adjustments at the half-year level, and the following half-year periods all showed clear recoveries. Compared with the daily and weekly charts, the half-year moving average filters out a large amount of short-term noise, making it easier to see changes in BTC’s larger-cycle capital structure.
Now the market is showing a similar formation again, but past performance doesn’t mean this time will necessarily repeat. The real key is whether the next half-year moving average can complete a strong bearish-to-bullish reversal, while also aligning with ongoing ETF inflows and improving spot absorption. Only if these conditions occur together will the signal for a large-scale trend reversal be more complete.
History won’t replicate exactly, but the large-cycle structure is worth keeping an eye on.
If this half-year moving average turns green again, BTC’s script is about to get interesting!
Click the card below—let’s get started!👇
$ETH $ZEC
In the past two bear markets, half-year moving average candles turned negative only twice.
But afterward, a strong green half-year moving average period followed!
More importantly, a new upward trend was launched right after that.
Now a similar historical pattern is once again right in front of us!
From the perspective of the half-year K-line, during the bear phases of the past two cycles, BTC experienced major adjustments at the half-year level, and the following half-year periods all showed clear recoveries. Compared with the daily and weekly charts, the half-year moving average filters out a large amount of short-term noise, making it easier to see changes in BTC’s larger-cycle capital structure.
Now the market is showing a similar formation again, but past performance doesn’t mean this time will necessarily repeat. The real key is whether the next half-year moving average can complete a strong bearish-to-bullish reversal, while also aligning with ongoing ETF inflows and improving spot absorption. Only if these conditions occur together will the signal for a large-scale trend reversal be more complete.
History won’t replicate exactly, but the large-cycle structure is worth keeping an eye on.
If this half-year moving average turns green again, BTC’s script is about to get interesting!
Click the card below—let’s get started!👇
$ETH $ZEC