Analysis of the FET/USDT asset
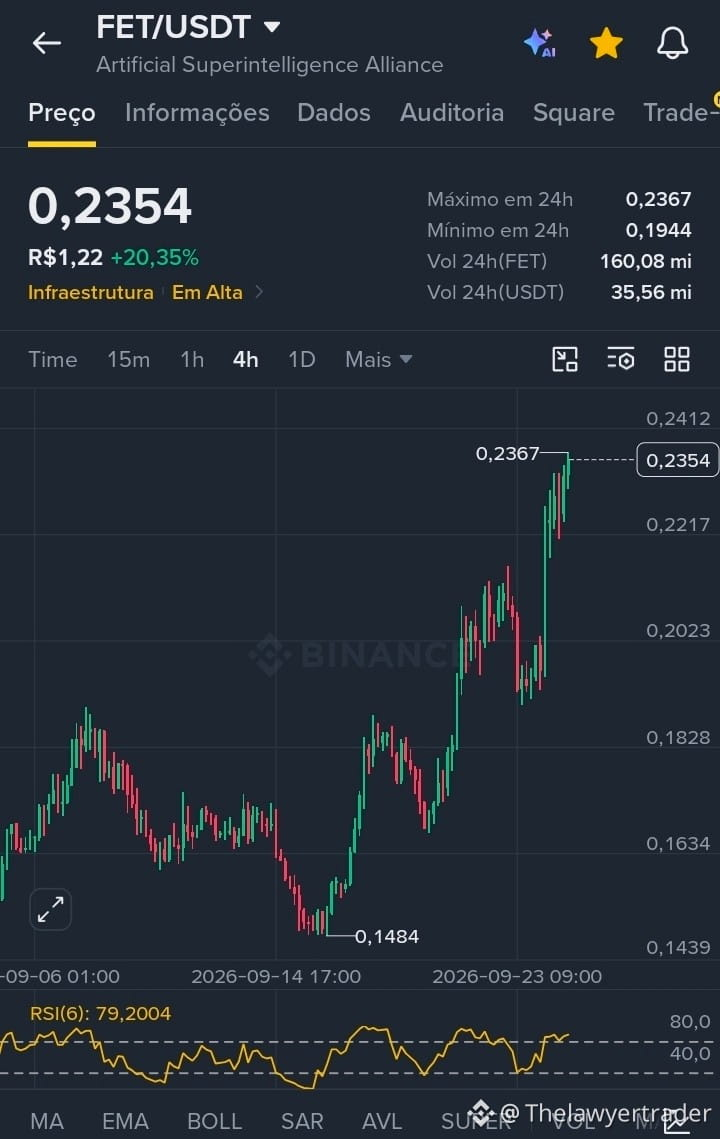
FET/USDT shows a consistent upward move on the 4-hour chart, rising from a low of 0.1484 to the current level of 0.2354, which represents an appreciation of approximately +20.35% over the period, with the price trading near the high of the last 24 hours (0.2367).
From a technical analysis standpoint, a clearly defined uptrend pattern is visible, with higher highs and higher lows, giving this move a moderate probability of continuation as long as the price remains above recent lows. However, the RSI (6) indicator is at 79.20—meaning it is in the overbought region (above 70)—signaling possible exhaustion of buying strength and the risk of a technical correction in the short term.
The trading volume over the last 24 hours was approximately 160 million FET, reinforcing the market’s active participation in this move.
In summary: the uptrend remains valid, but the overbought condition calls for caution; it is prudent to monitor the support levels nearby before considering new entries.
This analysis is based exclusively on chart data and does not constitute investment advice.
#FETUSD #FET.👀 $FET
FET/USDT shows a consistent upward move on the 4-hour chart, rising from a low of 0.1484 to the current level of 0.2354, which represents an appreciation of approximately +20.35% over the period, with the price trading near the high of the last 24 hours (0.2367).
From a technical analysis standpoint, a clearly defined uptrend pattern is visible, with higher highs and higher lows, giving this move a moderate probability of continuation as long as the price remains above recent lows. However, the RSI (6) indicator is at 79.20—meaning it is in the overbought region (above 70)—signaling possible exhaustion of buying strength and the risk of a technical correction in the short term.
The trading volume over the last 24 hours was approximately 160 million FET, reinforcing the market’s active participation in this move.
In summary: the uptrend remains valid, but the overbought condition calls for caution; it is prudent to monitor the support levels nearby before considering new entries.
This analysis is based exclusively on chart data and does not constitute investment advice.
#FETUSD #FET.👀 $FET