

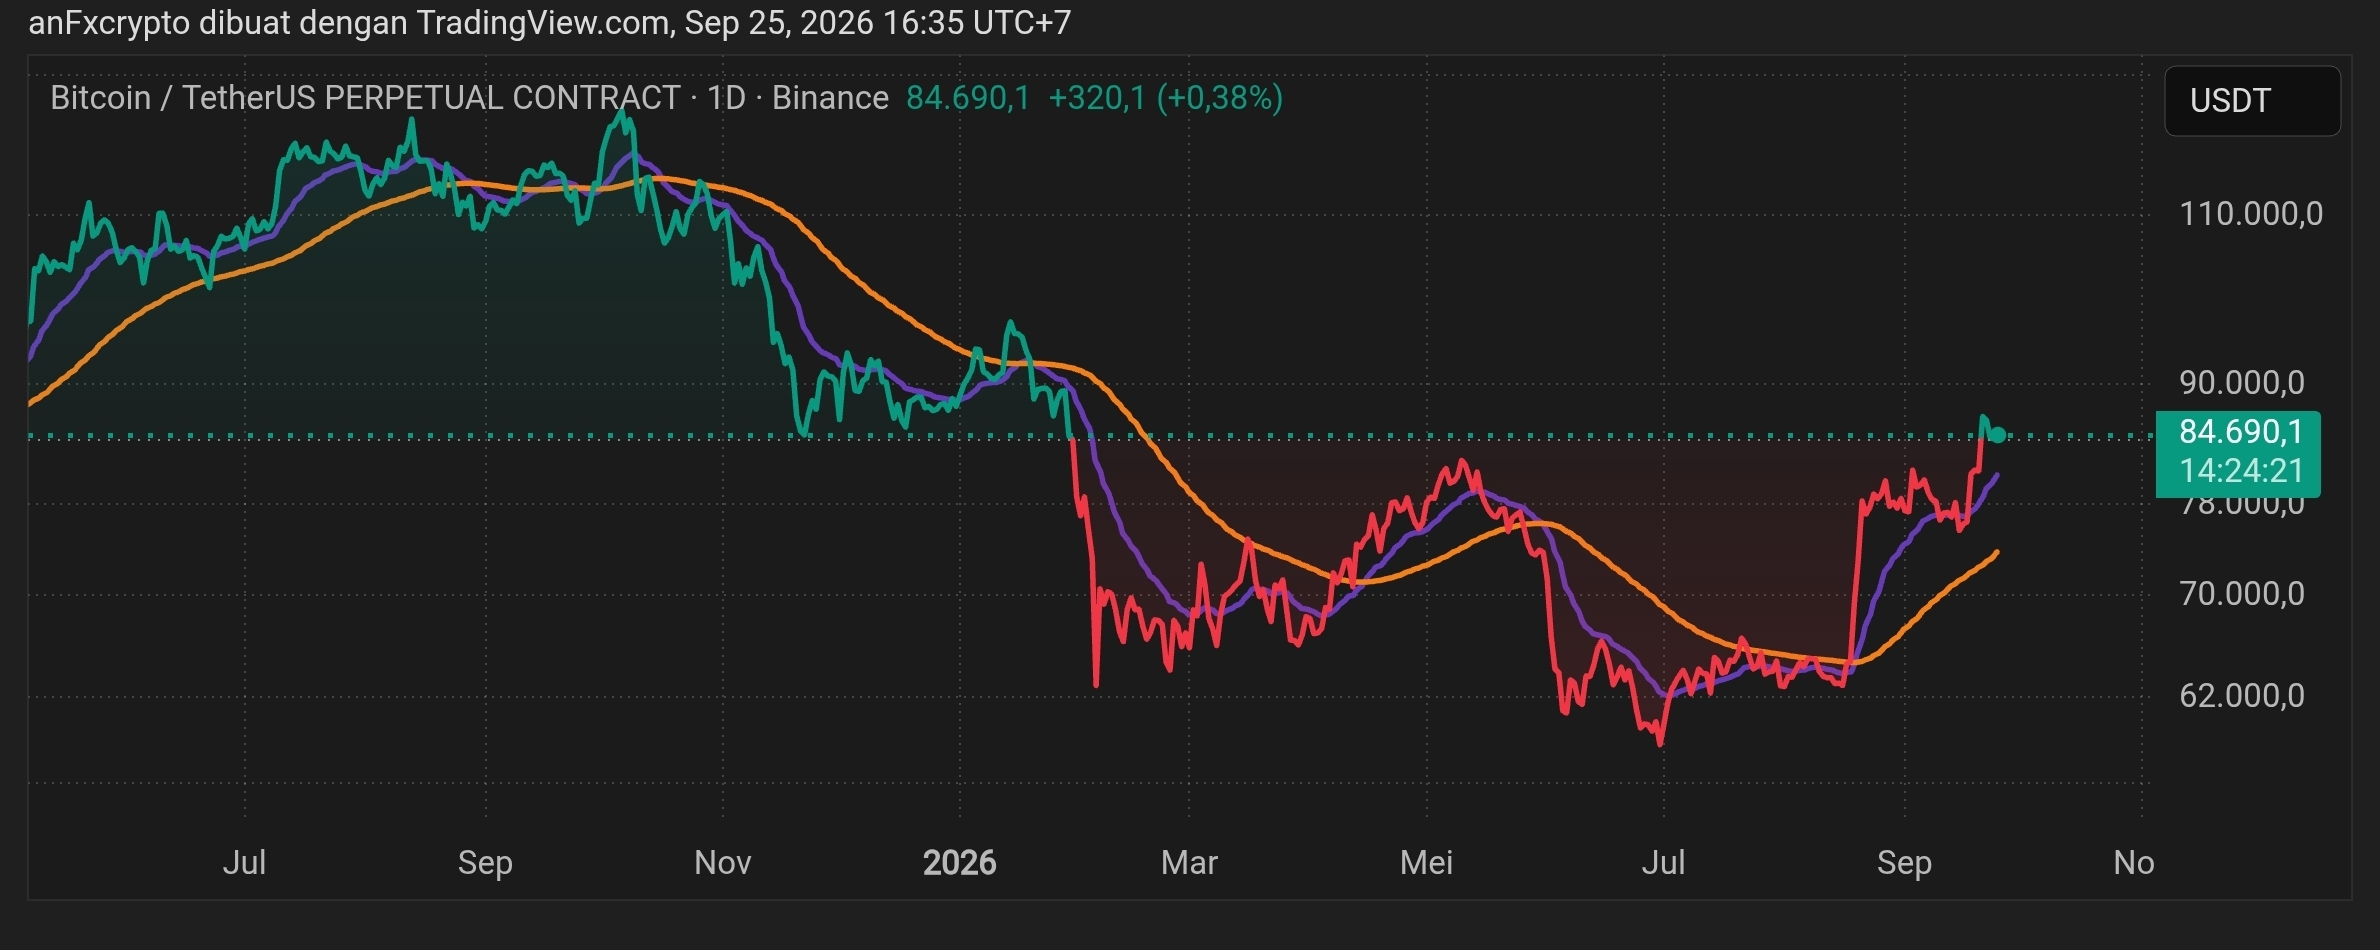

Quarterly Bitcoin Analysis ($BTC Quarterly Performance) refers to a summary of returns (percentage increase/decrease) of Bitcoin price measured over each three-month period:
Q1 (First Quarter): January – March
Q2 (Second Quarter): April – June
Q3 (Third Quarter): July – September
Q4 (Fourth Quarter): October – December
Historical BTC Seasonal Pattern
Based on the history of Bitcoin price movement since 2011:
Q1 (Beginning of the Year): Tends to move variably. Often there is a recovery after the New Year or profit-taking after the rally from the previous year’s end.
Q2 (Spring Rally): Historically, it’s one of the strongest quarters, with a median gain of about +18.7%.
Q3 (Consolidation/Summer Season): Known as the slowest quarter and tends to see a correction (historical median around +0.5%). Statistically, September is often the weakest month for BTC.
Q4 (Year End/Bull Run): Historically, it’s the most bullish quarter, with the highest median return (around ~+28.1%). This phenomenon’s narrative is often driven by “Uptober” and year-end closing rallies.
Latest Quarterly Performance Recap for Bitcoin
Year Q1 Q2 Q3 Q4 2024 +68.7% -12.0% +0.8% +47.6% 2025 -11.8% +29.8% +6.4% -23.1% 2026 -22.1% -14.1% +43.9% (as of Sep)—
Usefulness of Quarterly Analysis for Traders & Investors
Accumulation Cycle: Institutional and retail investors take advantage of the consolidation period in Q3 to accumulate/DCA ahead of potential Q4 gains.
Risk Management: Considering quarterly trends helps traders adjust leverage levels and expected volatility according to the season.
Portfolio Evaluation: Periodic portfolio adjustments (quarterly rebalancing) based on the macro and crypto market cycle.#BitcoinSpotETFsNetInflow$191M #CFTCUpdatesGuidanceOnTokenizedAssets #OndoFinanceSoughtSaleAfterFoundersDeath #BitcoinFallsBelow$83,000 #BitcoinFallsToAround$84,600ThisWeek