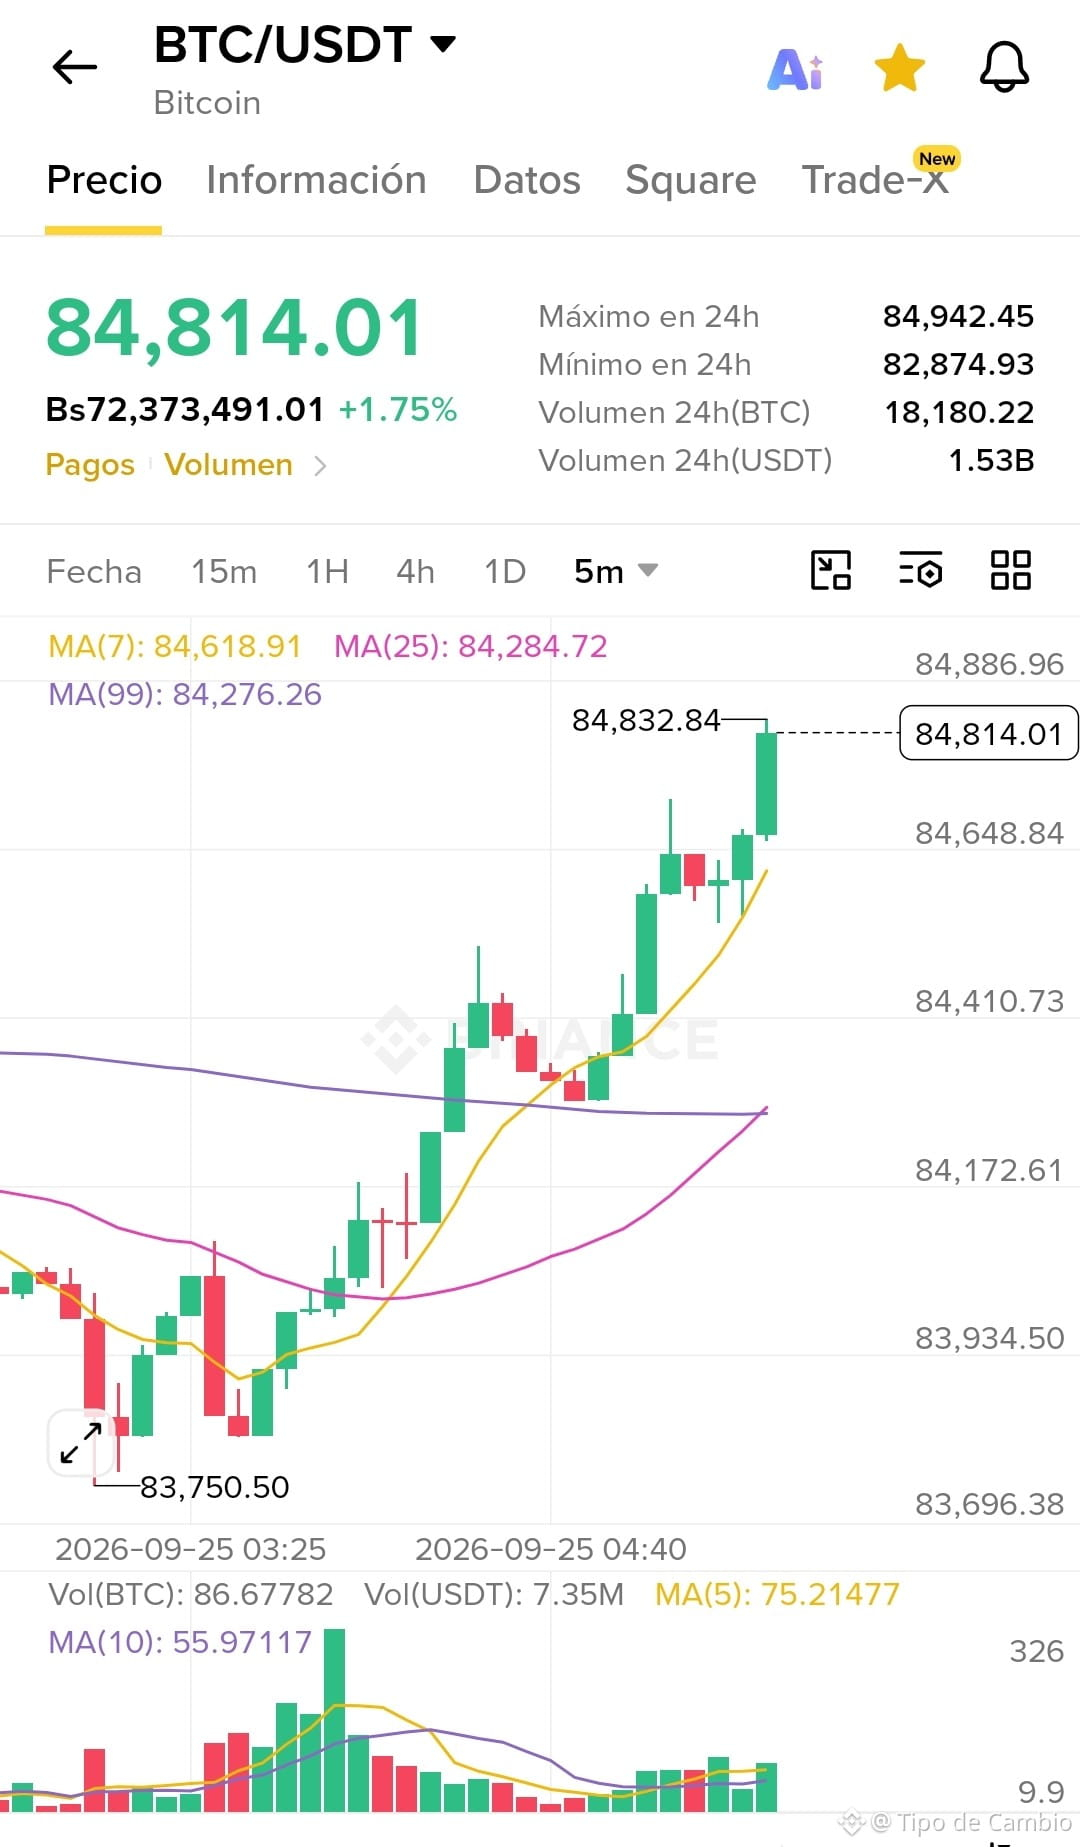
The idea that a single weekly candle can determine Bitcoin’s fate toward $100,000 is technically sound when the price consolidates near key resistance zones.
Technical Analysis and Breakout Scenarios
Currently, the market reflects a compression of volatility after attempting to surpass key levels in the $82,500–$85,000 range. The weekly candle close will determine whether the trend continues toward six figures or if it needs a longer accumulation phase.
1. Bullish Scenario: Confirmation Toward $100,000
Trigger: The weekly candle closes with a solid body above the $84,000–$85,000 zone, accompanied by a significant increase in trading volume.
Trajectory:
Breakout confirmation after surpassing $85,000.
First stop and partial profit-taking at $89,000–$90,000.
Extension toward the psychological barrier of $100,000.
2. Neutral / Bearish Scenario: Rejection and Consolidation
Trigger: The weekly candle leaves a long upper wick (Shooting Star or a selling-absorption wick) or closes below the defensive support of $82,500.
Consequence: A retest of the exponential moving averages (20/50-period EMA) in the $77,800–$78,000 band, pushing the $100K target back to the next quarter.
Candle Patterns to Monitor
#BinanceWillListHyperliquid(HYPE)
Technical Analysis and Breakout Scenarios
Currently, the market reflects a compression of volatility after attempting to surpass key levels in the $82,500–$85,000 range. The weekly candle close will determine whether the trend continues toward six figures or if it needs a longer accumulation phase.
1. Bullish Scenario: Confirmation Toward $100,000
Trigger: The weekly candle closes with a solid body above the $84,000–$85,000 zone, accompanied by a significant increase in trading volume.
Trajectory:
Breakout confirmation after surpassing $85,000.
First stop and partial profit-taking at $89,000–$90,000.
Extension toward the psychological barrier of $100,000.
2. Neutral / Bearish Scenario: Rejection and Consolidation
Trigger: The weekly candle leaves a long upper wick (Shooting Star or a selling-absorption wick) or closes below the defensive support of $82,500.
Consequence: A retest of the exponential moving averages (20/50-period EMA) in the $77,800–$78,000 band, pushing the $100K target back to the next quarter.
Candle Patterns to Monitor
#BinanceWillListHyperliquid(HYPE)