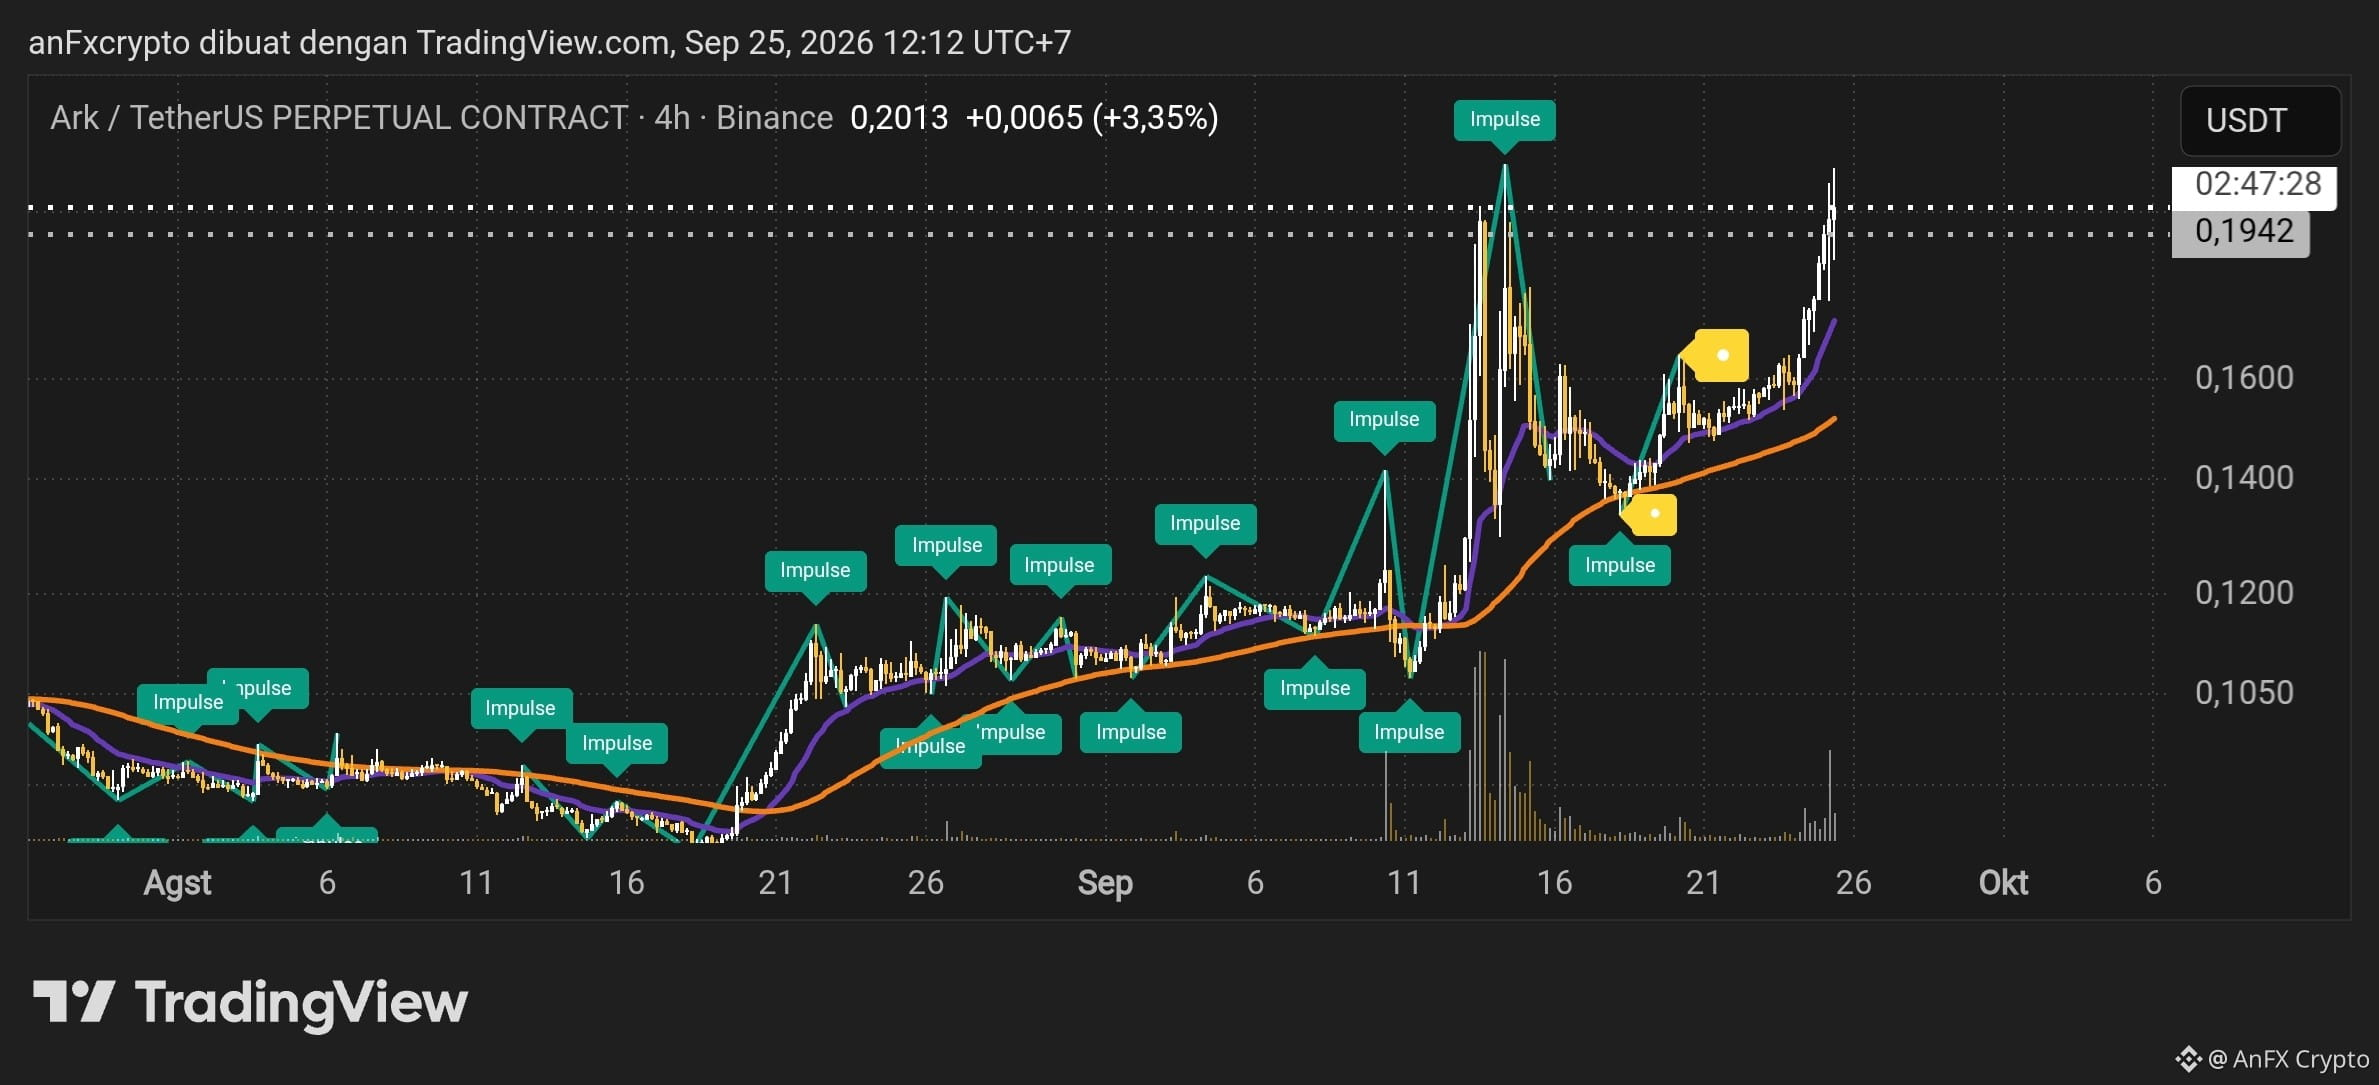
Here is a technical analysis and trading plan recommendation for $ARK /USDT (Perpetual 4H):
1. Technical Analysis (Timeframe 4H)
Market Structure & Trend: The current trend is strongly Bullish. You can see the formation of successive impulse waves after a strong bounce from the support area around 0.1400.
Main Resistance Zone: Price is currently testing the critical resistance line in the range 0.1940 – 0.2015 (the horizontal dashed line). This is the previous swing high point in mid-September.
Moving Average (EMA): The purple and orange EMA lines show an upward crossover (golden cross) and curve upward, confirming strong buying momentum. However, the current price is quite far (overextended) from the EMA line, which increases the possibility of a short-term correction (pullback) before continuing higher.
2. Signals & Trading Plan
Since price is right in an important resistance area, there are two high-probability scenarios:
Scenario A: Buy on Breakout (Momentum / Aggressive Type)
If price successfully breaks through and closes the 4H candle above the resistance zone.
Buy Stop / Entry: 0.2020 – 0.2050 (After confirmation of a 4H candle close above resistance)
Take Profit 1 (TP1): 0.2200
Take Profit 2 (TP2): 0.2450
Stop Loss (SL): 0.1880 (Below the breakout area)
Scenario B: Buy on Dip / Retrace (Conservative - Low Risk Type)
Wait for price to correct healthily first into the support/EMA area before entering.
Buy Limit / Entry Zone: 0.1600 – 0.1680
Take Profit 1 (TP1): 0.1940
Take Profit 2 (TP2): 0.2150
Stop Loss (SL): 0.1490 (Below the EMA line & local support)
3. Risk Management
Research & Confirmation: Don’t do a FOMO Buy just below the resistance line 0.1940 - 0.2015 without a clear breakout.
Position Sizing: Use a maximum risk of 1% – 2% of your total capital per position.
Volatility Warning: Perpetual contracts have high leverage; always place a Stop Loss to avoid liquidation if the market suddenly turns against you.
1. Technical Analysis (Timeframe 4H)
Market Structure & Trend: The current trend is strongly Bullish. You can see the formation of successive impulse waves after a strong bounce from the support area around 0.1400.
Main Resistance Zone: Price is currently testing the critical resistance line in the range 0.1940 – 0.2015 (the horizontal dashed line). This is the previous swing high point in mid-September.
Moving Average (EMA): The purple and orange EMA lines show an upward crossover (golden cross) and curve upward, confirming strong buying momentum. However, the current price is quite far (overextended) from the EMA line, which increases the possibility of a short-term correction (pullback) before continuing higher.
2. Signals & Trading Plan
Since price is right in an important resistance area, there are two high-probability scenarios:
Scenario A: Buy on Breakout (Momentum / Aggressive Type)
If price successfully breaks through and closes the 4H candle above the resistance zone.
Buy Stop / Entry: 0.2020 – 0.2050 (After confirmation of a 4H candle close above resistance)
Take Profit 1 (TP1): 0.2200
Take Profit 2 (TP2): 0.2450
Stop Loss (SL): 0.1880 (Below the breakout area)
Scenario B: Buy on Dip / Retrace (Conservative - Low Risk Type)
Wait for price to correct healthily first into the support/EMA area before entering.
Buy Limit / Entry Zone: 0.1600 – 0.1680
Take Profit 1 (TP1): 0.1940
Take Profit 2 (TP2): 0.2150
Stop Loss (SL): 0.1490 (Below the EMA line & local support)
3. Risk Management
Research & Confirmation: Don’t do a FOMO Buy just below the resistance line 0.1940 - 0.2015 without a clear breakout.
Position Sizing: Use a maximum risk of 1% – 2% of your total capital per position.
Volatility Warning: Perpetual contracts have high leverage; always place a Stop Loss to avoid liquidation if the market suddenly turns against you.