LONG $B2 | Indicator in the 1h chart not hot and not cold yet — what could make this scenario wrong?
🚨 AI TRADE ALERT — $B2
🟢 LONG
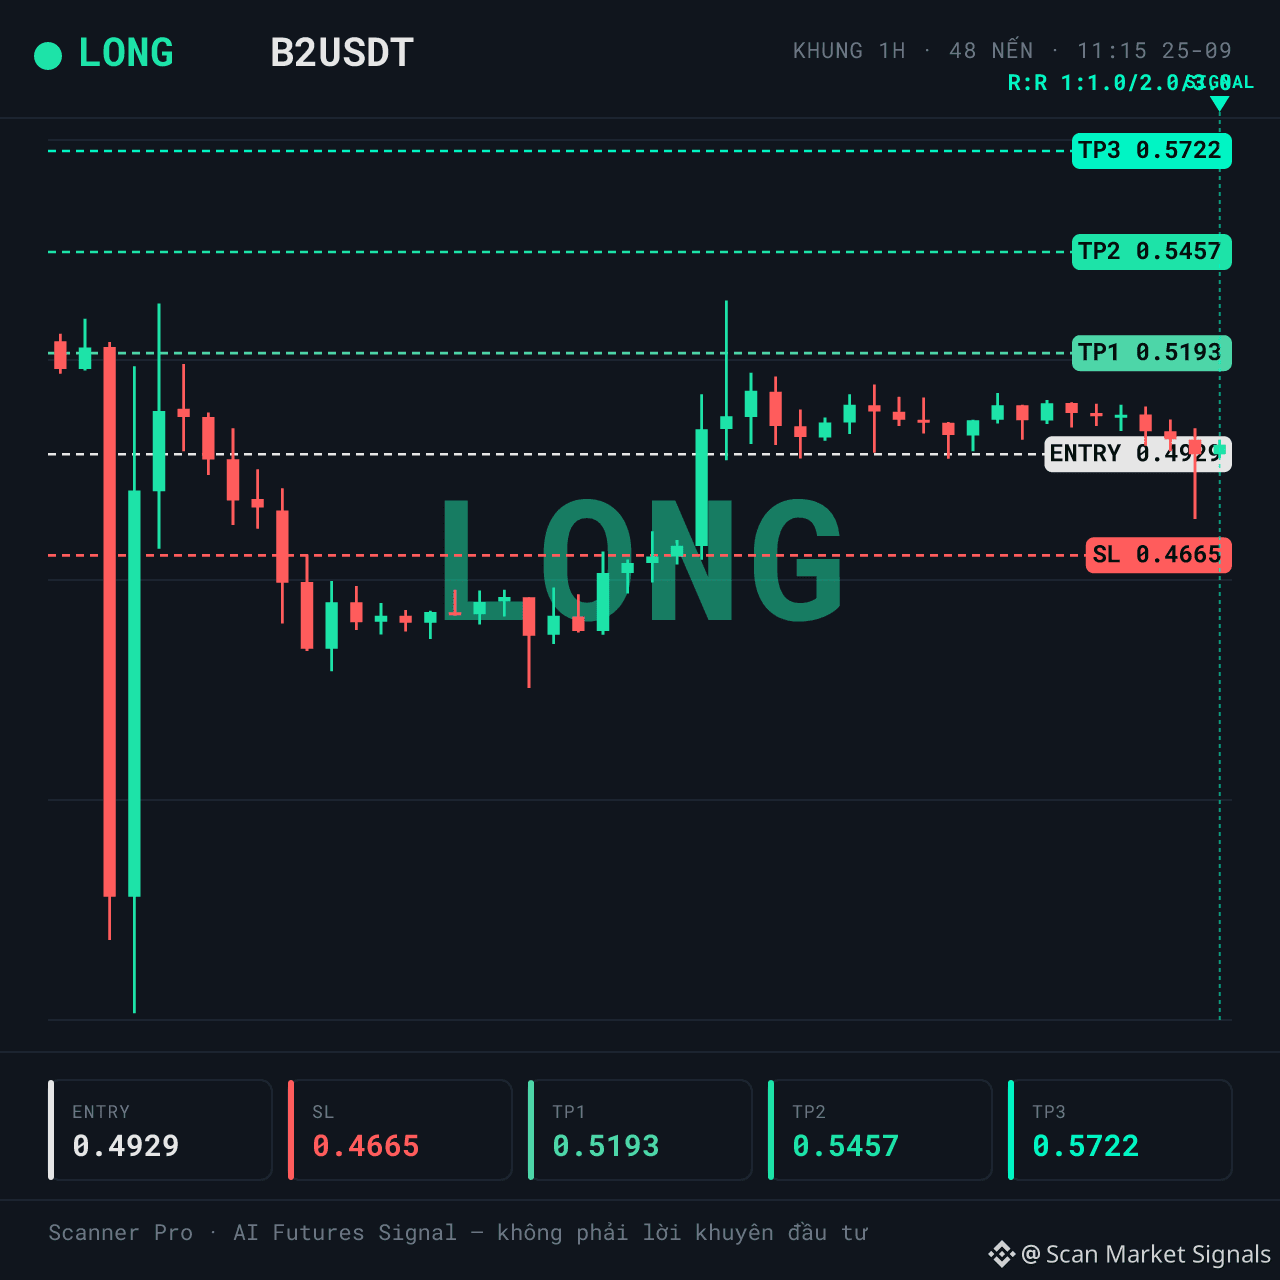
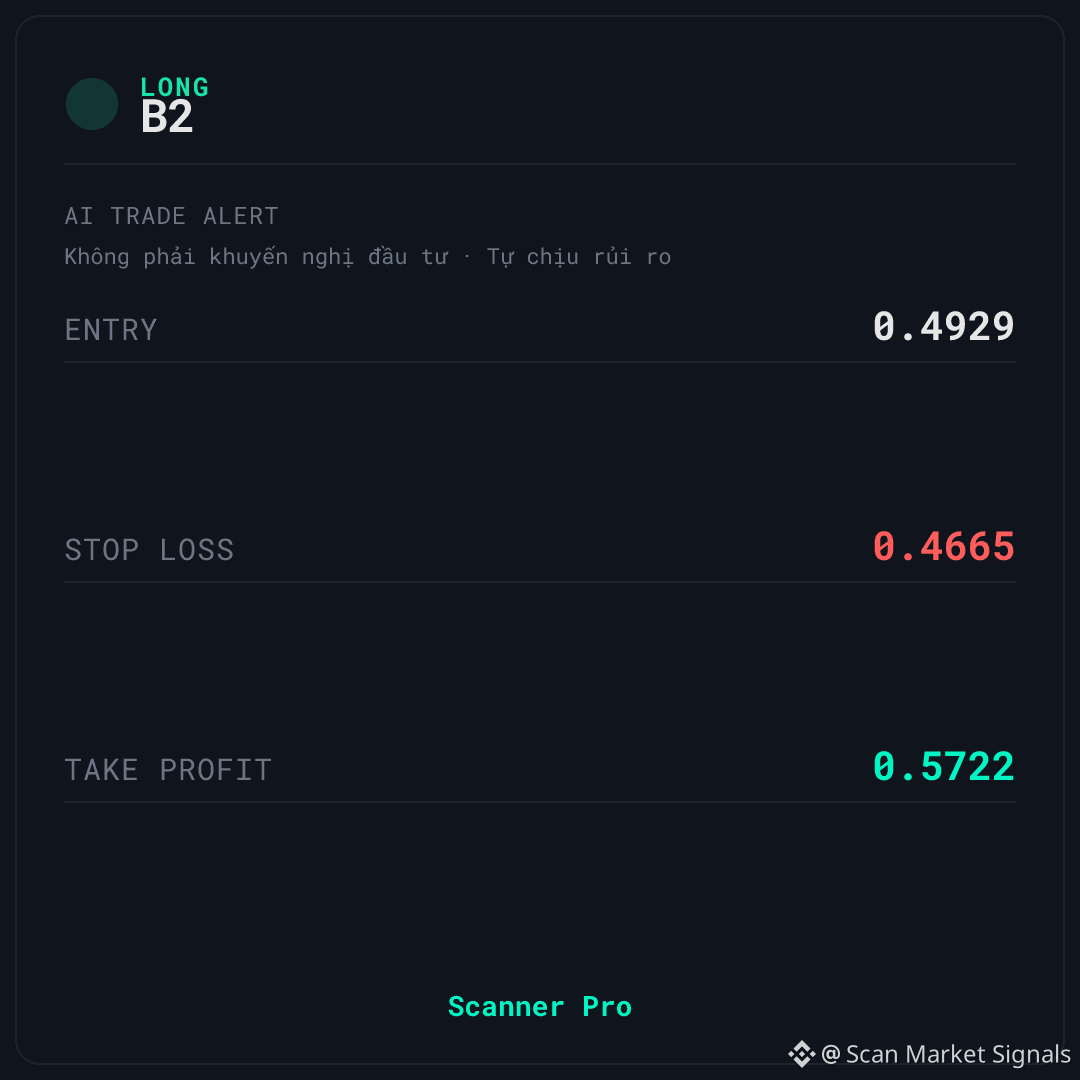
📌 Entry: 0.4922 – 0.4936
🛑 Stop Loss: 0.4665
🎯 Take Profit: 0.5722
⏰ Valid for: 6 hours (11:15 – 17:15 VN) - Date: 25/09
↔️ SIDEWAY — the market is moving sideways; the signal is fading (mean-reversion)
$B2 is being monitored by Scanner Pro under a LONG scenario when price reacts around the balance zone of the 24h range. The context is classified as sideways with a classification confidence of 55; 24h volume is about 23.334.249 USDT, and the spike ratio is only 0.08x.
📊 WHAT THE DATA IS SHOWING
The downside immediately stands out: funding of 0.0162% means the LONG side is paying the SHORT side—so the crowd is leaning in the SAME direction as this signal. This is a risk to watch, not a positive.
Also, the classification confidence for the context is only 55, so the label "sideways" is not very solid yet.
On the support side, price is hovering around 48% of the 24h range — a mid-zone, neither pushed to the highs nor pressed to the lows, and there is still room before the stop-loss level on the signal card. The 1h indicator at 48.86 is close to neutral, providing no clear overbought or oversold signal yet.
💡 SCENARIO & OPEN QUESTIONS — $B2
🚫 The biggest conflict: the LONG side is crowded and has to pay funding. So if price fails to hold the current zone, pressure from this same side could drive a deeper adjustment.
If price closes below the stop-loss level on the signal card, the current LONG scenario is no longer valid.
In your opinion, is this a true accumulation phase, or just a middle zone within the range that’s prone to being swept both ways?
This is educational technical analysis content, not investment advice. Crypto trading has high risk, and you may lose all of your capital. Please do your own research and be responsible for your decisions.
#Binance #Crypto #Futures
🚨 AI TRADE ALERT — $B2
🟢 LONG
📌 Entry: 0.4922 – 0.4936
🛑 Stop Loss: 0.4665
🎯 Take Profit: 0.5722
⏰ Valid for: 6 hours (11:15 – 17:15 VN) - Date: 25/09
↔️ SIDEWAY — the market is moving sideways; the signal is fading (mean-reversion)
$B2 is being monitored by Scanner Pro under a LONG scenario when price reacts around the balance zone of the 24h range. The context is classified as sideways with a classification confidence of 55; 24h volume is about 23.334.249 USDT, and the spike ratio is only 0.08x.
📊 WHAT THE DATA IS SHOWING
The downside immediately stands out: funding of 0.0162% means the LONG side is paying the SHORT side—so the crowd is leaning in the SAME direction as this signal. This is a risk to watch, not a positive.
Also, the classification confidence for the context is only 55, so the label "sideways" is not very solid yet.
On the support side, price is hovering around 48% of the 24h range — a mid-zone, neither pushed to the highs nor pressed to the lows, and there is still room before the stop-loss level on the signal card. The 1h indicator at 48.86 is close to neutral, providing no clear overbought or oversold signal yet.
💡 SCENARIO & OPEN QUESTIONS — $B2
🚫 The biggest conflict: the LONG side is crowded and has to pay funding. So if price fails to hold the current zone, pressure from this same side could drive a deeper adjustment.
If price closes below the stop-loss level on the signal card, the current LONG scenario is no longer valid.
In your opinion, is this a true accumulation phase, or just a middle zone within the range that’s prone to being swept both ways?
This is educational technical analysis content, not investment advice. Crypto trading has high risk, and you may lose all of your capital. Please do your own research and be responsible for your decisions.
#Binance #Crypto #Futures