#ONE/USDT
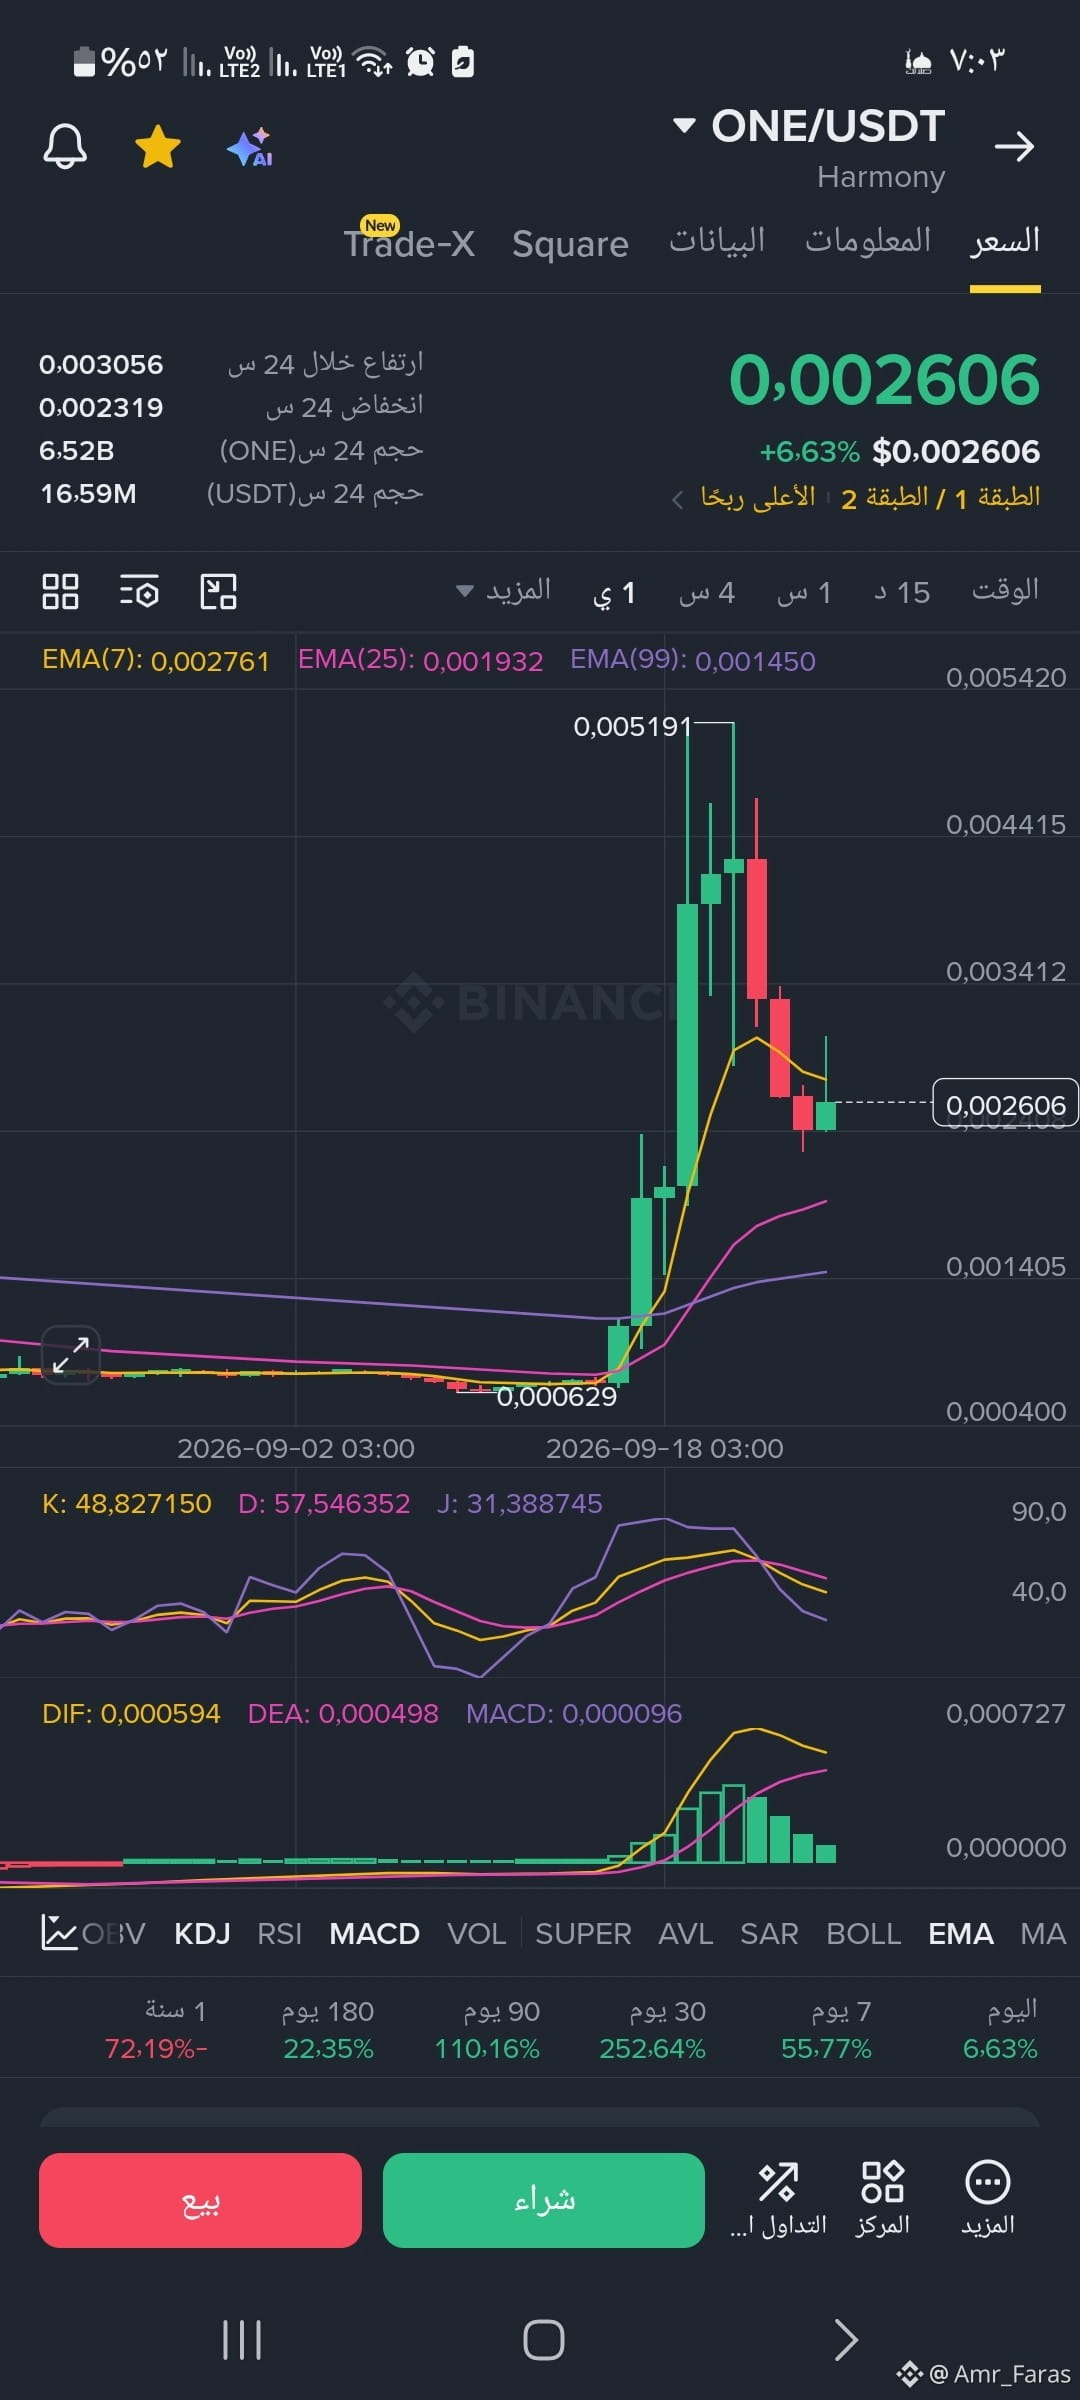
📊 Technical analysis of the current indicators📌 Price movement and Japanese candlesticks: The price recently saw a strong upward wave, pushing toward the visible peak at $0.005191. After touching this peak, the price entered a phase of sharp downward correction, represented by consecutive red candlesticks. It is currently stabilizing at the $0.002606 level.📌 Exponential Moving Averages (EMA): EMA(7) in yellow: at $0.002761. EMA(25) in purple: at $0.001932. EMA(99) in violet: at $0.001450. The current price is trading just below the EMA(7) line, but it is still above EMA(25) and EMA(99). This indicates a short-term correction, while the overall long-term trend continues to hold its key supports.📌 MACD indicator (Moving Average Convergence Divergence): DIF line at 0.000594 and DEA line at 0.000498. The histogram bar shows a decrease in bullish momentum (the green lines are getting shorter), reflecting temporarily weaker buying power and increased selling pressure during the recent period.
📊 Technical analysis of the current indicators📌 Price movement and Japanese candlesticks: The price recently saw a strong upward wave, pushing toward the visible peak at $0.005191. After touching this peak, the price entered a phase of sharp downward correction, represented by consecutive red candlesticks. It is currently stabilizing at the $0.002606 level.📌 Exponential Moving Averages (EMA): EMA(7) in yellow: at $0.002761. EMA(25) in purple: at $0.001932. EMA(99) in violet: at $0.001450. The current price is trading just below the EMA(7) line, but it is still above EMA(25) and EMA(99). This indicates a short-term correction, while the overall long-term trend continues to hold its key supports.📌 MACD indicator (Moving Average Convergence Divergence): DIF line at 0.000594 and DEA line at 0.000498. The histogram bar shows a decrease in bullish momentum (the green lines are getting shorter), reflecting temporarily weaker buying power and increased selling pressure during the recent period.