$ZEC
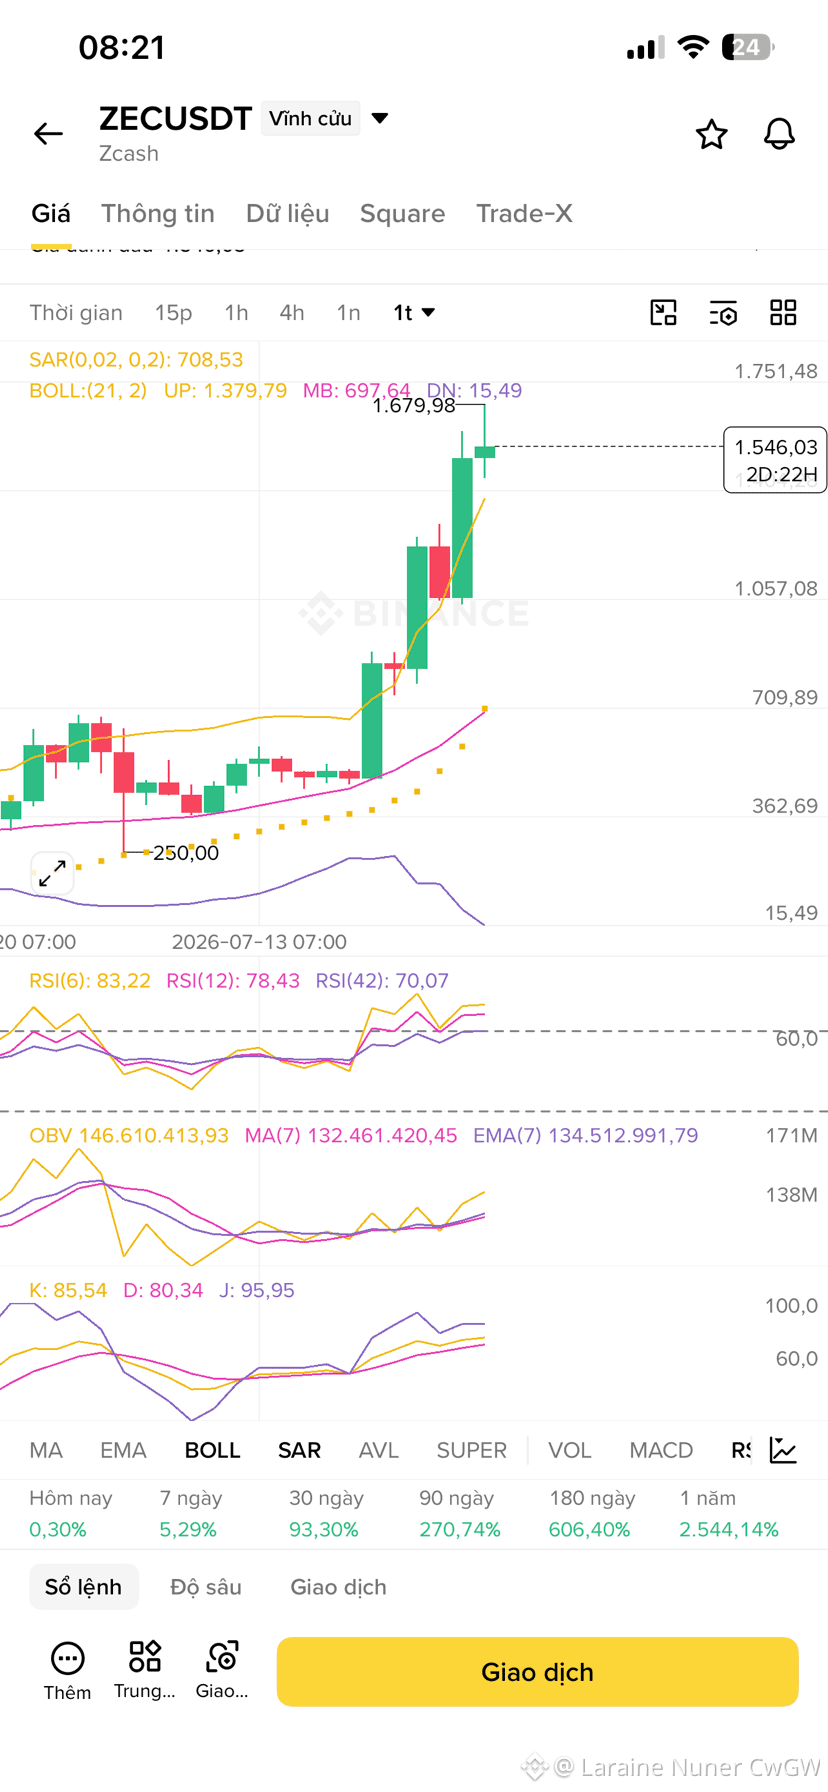
The weekly chart is currently in a hot buying zone, with prices rising and breaking above the upper Bollinger Band. The weekly chart is still far away and is only adjusting slightly.
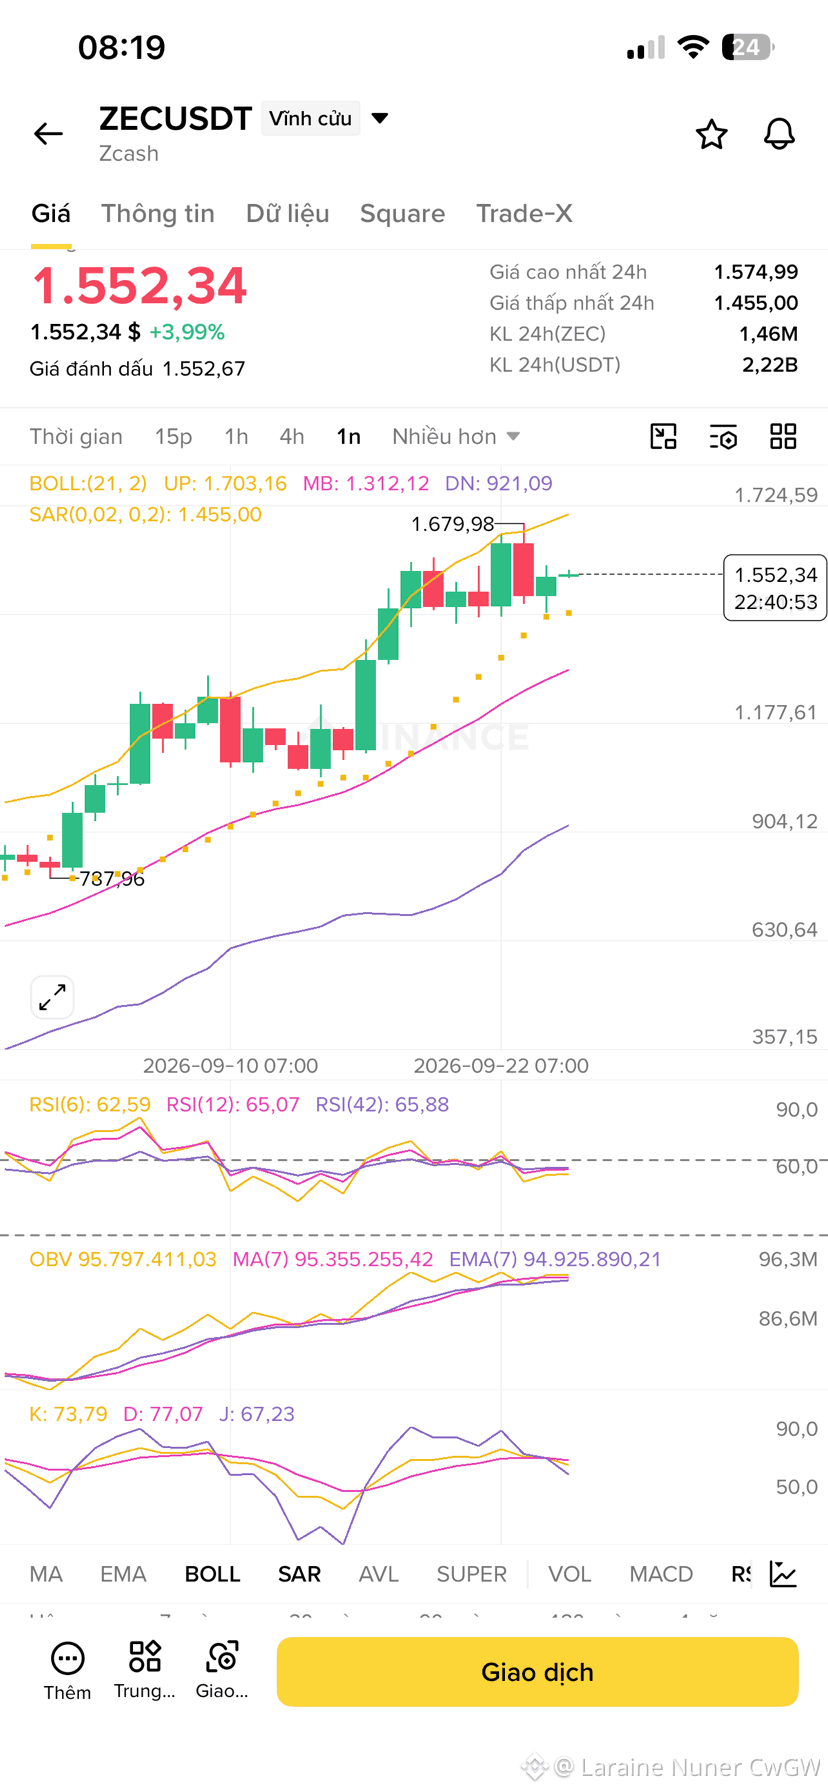
D1 shows that the increasing momentum is weakening in the peak zone.
At the moment, it’s less attractive than the ones that haven’t yet risen. Check the Ma50–ema50 on the weekly chart, since it’s at a lower price area than the other L1.
Be careful—there may be a pullback after the rally.
The weekly chart is currently in a hot buying zone, with prices rising and breaking above the upper Bollinger Band. The weekly chart is still far away and is only adjusting slightly.
D1 shows that the increasing momentum is weakening in the peak zone.
At the moment, it’s less attractive than the ones that haven’t yet risen. Check the Ma50–ema50 on the weekly chart, since it’s at a lower price area than the other L1.
Be careful—there may be a pullback after the rally.