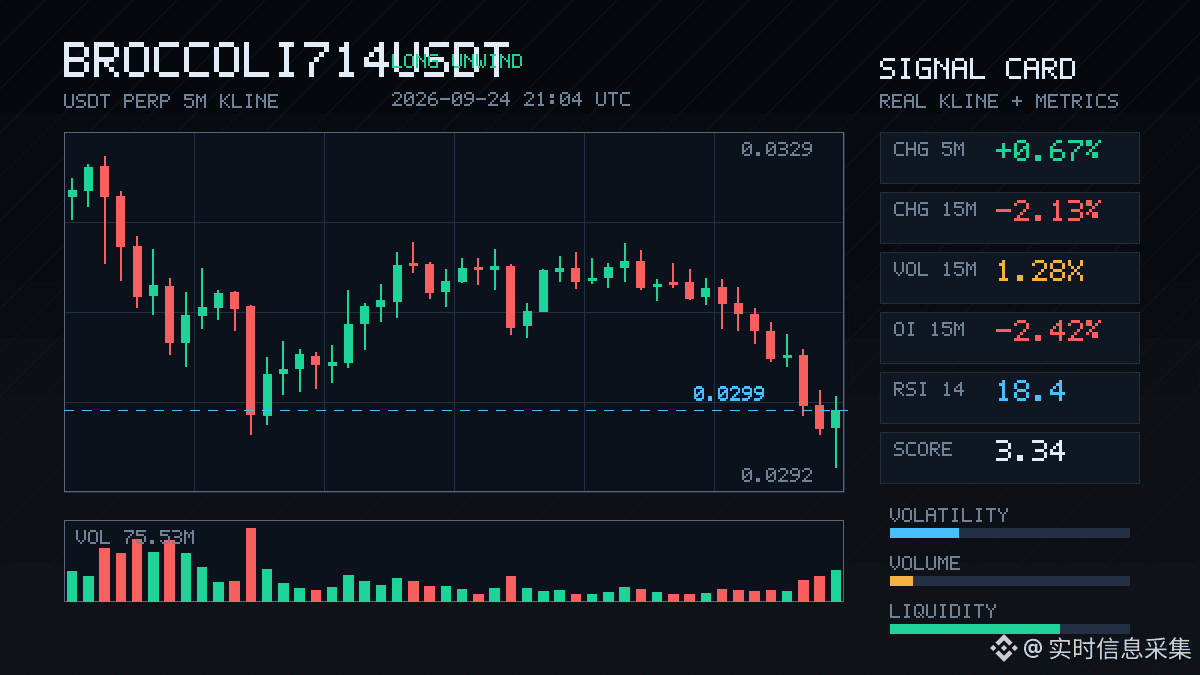
$BROCCOLI714 This wave isn't a normal pullback—it’s leverage moving.
In the 15m chart, it dropped 2.13%, while OI also fell by 2.42%. On the one-hour dimension, OI dropped directly by 4.67%, reducing notional by 720,000 U. Price is down + positions are shrinking—textbook-style long deleveraging, with stop-losses and passive position reduction tangled together.
OI abnormal percentile is 92.1%, ranking 5th in the whole pool. It has been continuing across several consecutive cycles; this level of depth confirmation is worth watching more than any single candlestick.
Active trade imbalance is -3.4%, buy/sell ratio is 0.93. Sell pressure is pressing down, but not to the point of panic and stampede liquidation. In the past 24h there’s still 132 million U in trading volume—there’s no shortage of participants in the pool.
The key now isn’t how much it’s fallen, but when this deleveraging leg will stop. Before OI stops falling, any rebound has to be questioned.
In the 15m chart, it dropped 2.13%, while OI also fell by 2.42%. On the one-hour dimension, OI dropped directly by 4.67%, reducing notional by 720,000 U. Price is down + positions are shrinking—textbook-style long deleveraging, with stop-losses and passive position reduction tangled together.
OI abnormal percentile is 92.1%, ranking 5th in the whole pool. It has been continuing across several consecutive cycles; this level of depth confirmation is worth watching more than any single candlestick.
Active trade imbalance is -3.4%, buy/sell ratio is 0.93. Sell pressure is pressing down, but not to the point of panic and stampede liquidation. In the past 24h there’s still 132 million U in trading volume—there’s no shortage of participants in the pool.
The key now isn’t how much it’s fallen, but when this deleveraging leg will stop. Before OI stops falling, any rebound has to be questioned.