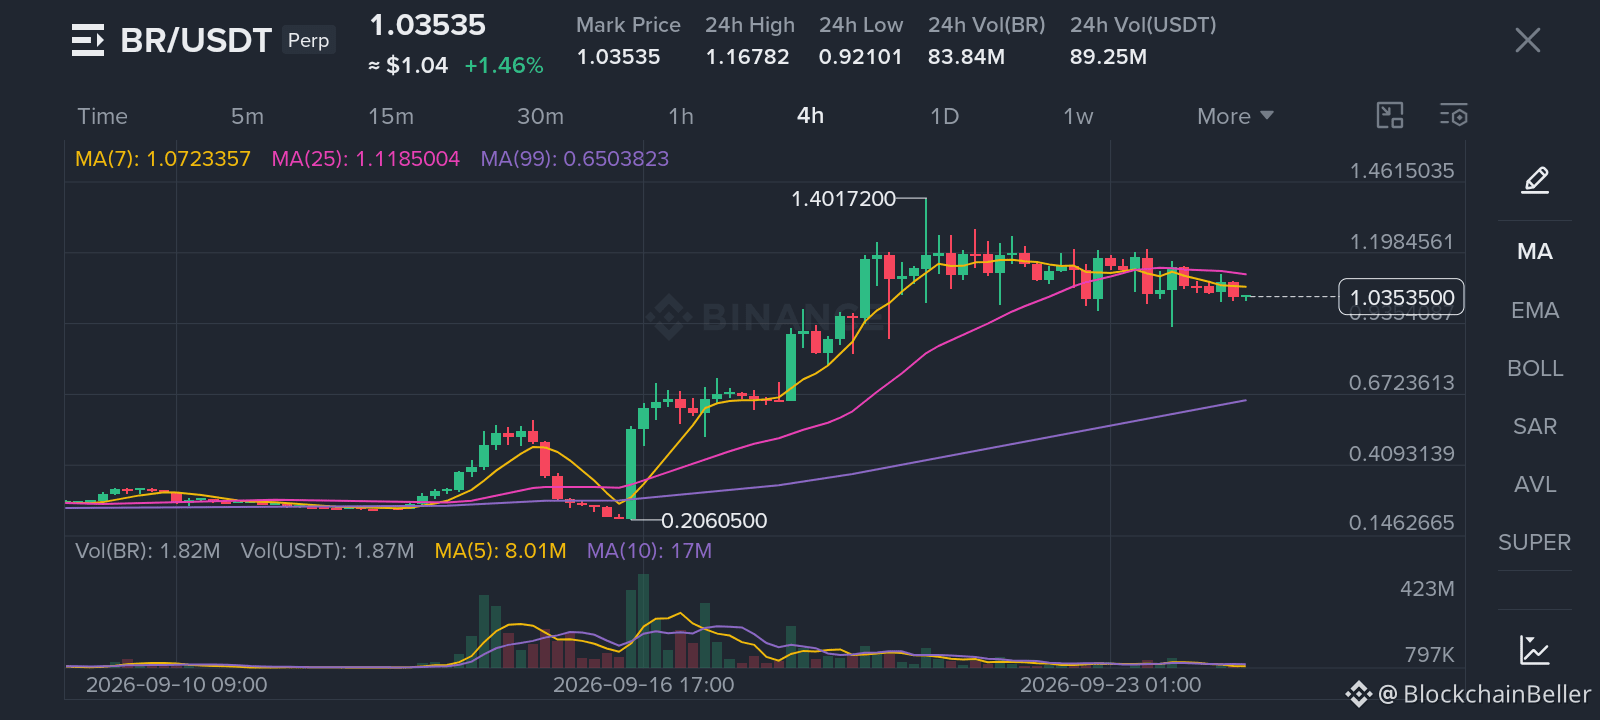
Short BR setup: the levels I monitor
$BR /USDT · 🔴 Bias: SHORT (cautious) · 6/12 signals aligned
Technical verdict: Cautious SHORT. 6 out of 12 aligned signals, 2 against.
What supports it (6):
✅ 1-hour direction: Price < EMA50 < EMA200, a bearish structure is forming
✅ Trend strength (ADX/DI, 15 minutes): ADX 26.4 with sellers in control (DI- 22.8 vs DI+ 14.6)
✅ RSI on 4 hours: 42.6, bearish momentum
✅ RSI on 1 hour: 38.4, below 55 and losing ground
✅ Relative strength vs BTC: weak performance, -3.2% vs BTC
✅ Volume: increasing on red candles, confirming distribution
What contradicts it (2):
⚠️ 4-hour direction: Price > EMA50 > EMA200, the bullish structure is still intact
⚠️ Support at 0.6503 (MA99): a strong dynamic support that could trigger a rebound
Price map:
📍 Entry: 1.030 – 1.050
🎯 Target 1: 0.950
🎯 Target 2: 0.850
🎯 Target 3: 0.750
🔴 Stop-loss: 1.120
Why this setup?
The daily trend is bullish, but 6 out of 12 aligned signals favor the short side for a correction. The plan is to work in the 1.030 – 1.050 zone, take profits at 0.950 and 0.850, and wait patiently until 0.750. A move through 1.120 means the idea is wrong, and the stop will do its job.
Your call:
Will BR reach 0.950 first, or hit the stop-loss?
Levels are shown on the chart below 👇
⚠️ Personal market analysis only. Not financial advice — manage your risk and do your own research.
$BR /USDT · 🔴 Bias: SHORT (cautious) · 6/12 signals aligned
Technical verdict: Cautious SHORT. 6 out of 12 aligned signals, 2 against.
What supports it (6):
✅ 1-hour direction: Price < EMA50 < EMA200, a bearish structure is forming
✅ Trend strength (ADX/DI, 15 minutes): ADX 26.4 with sellers in control (DI- 22.8 vs DI+ 14.6)
✅ RSI on 4 hours: 42.6, bearish momentum
✅ RSI on 1 hour: 38.4, below 55 and losing ground
✅ Relative strength vs BTC: weak performance, -3.2% vs BTC
✅ Volume: increasing on red candles, confirming distribution
What contradicts it (2):
⚠️ 4-hour direction: Price > EMA50 > EMA200, the bullish structure is still intact
⚠️ Support at 0.6503 (MA99): a strong dynamic support that could trigger a rebound
Price map:
📍 Entry: 1.030 – 1.050
🎯 Target 1: 0.950
🎯 Target 2: 0.850
🎯 Target 3: 0.750
🔴 Stop-loss: 1.120
Why this setup?
The daily trend is bullish, but 6 out of 12 aligned signals favor the short side for a correction. The plan is to work in the 1.030 – 1.050 zone, take profits at 0.950 and 0.850, and wait patiently until 0.750. A move through 1.120 means the idea is wrong, and the stop will do its job.
Your call:
Will BR reach 0.950 first, or hit the stop-loss?
Levels are shown on the chart below 👇
⚠️ Personal market analysis only. Not financial advice — manage your risk and do your own research.