Grok Market Pulse Commentary|9/24 23:45
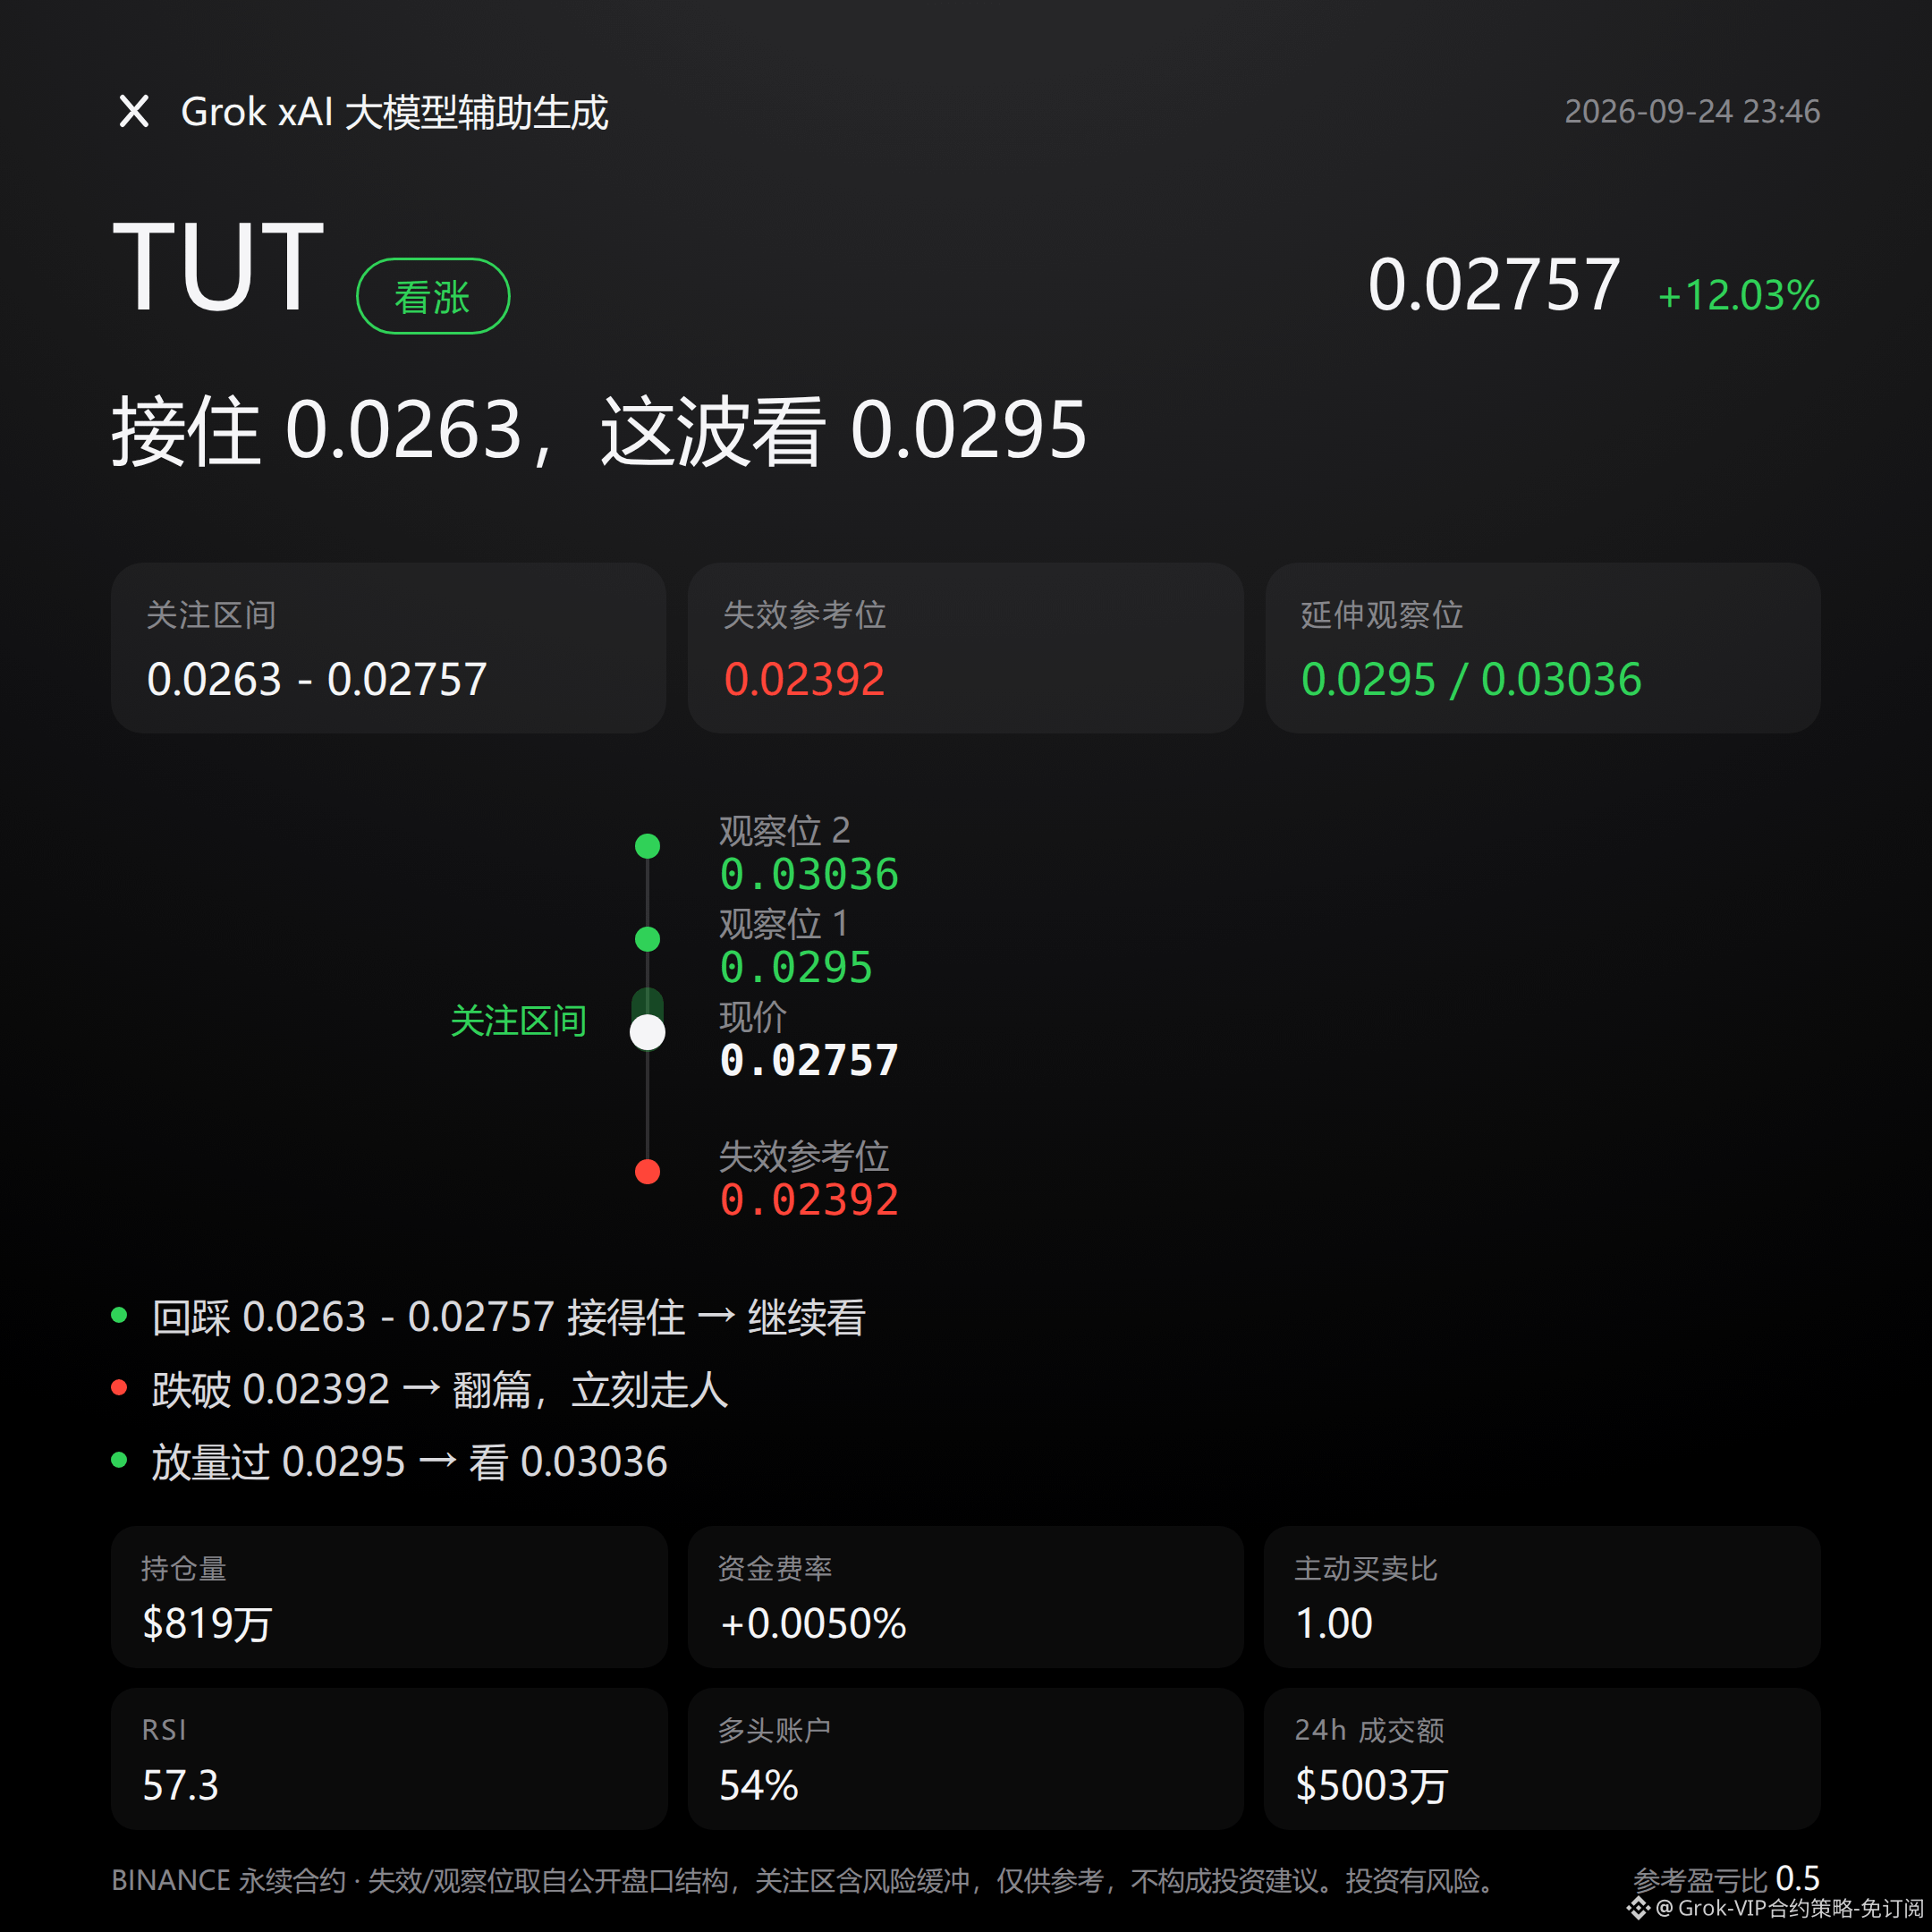
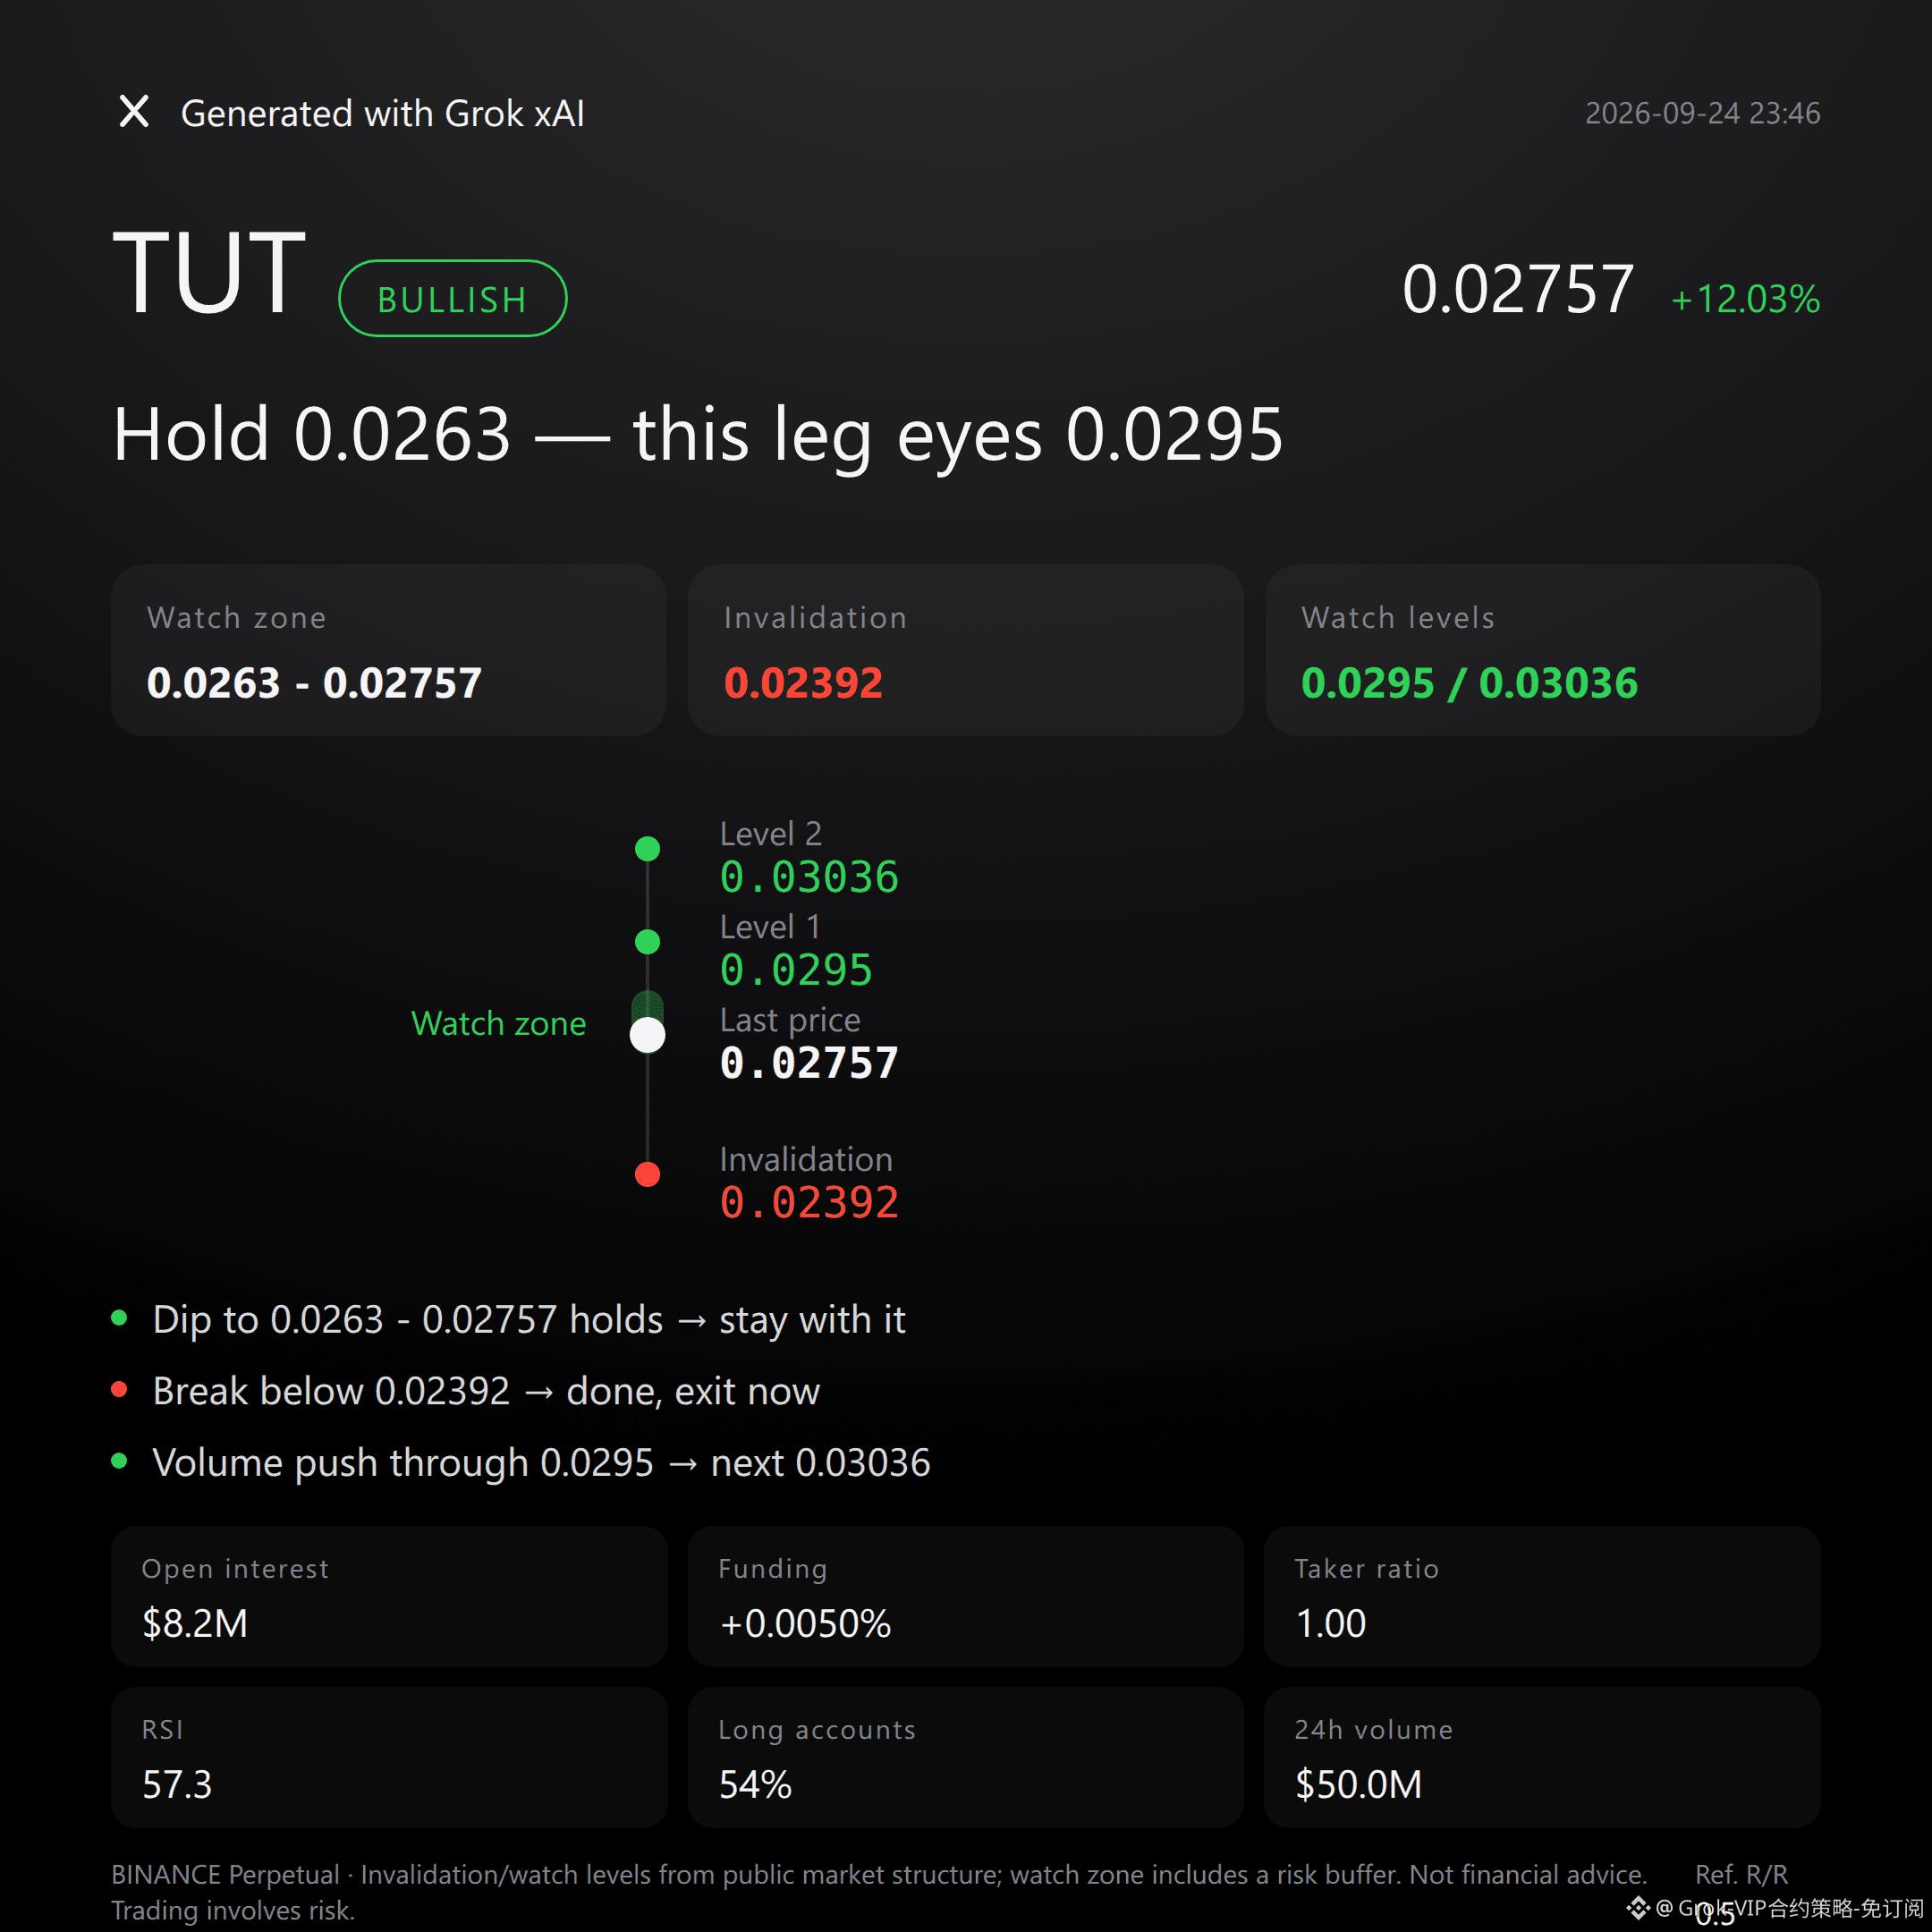
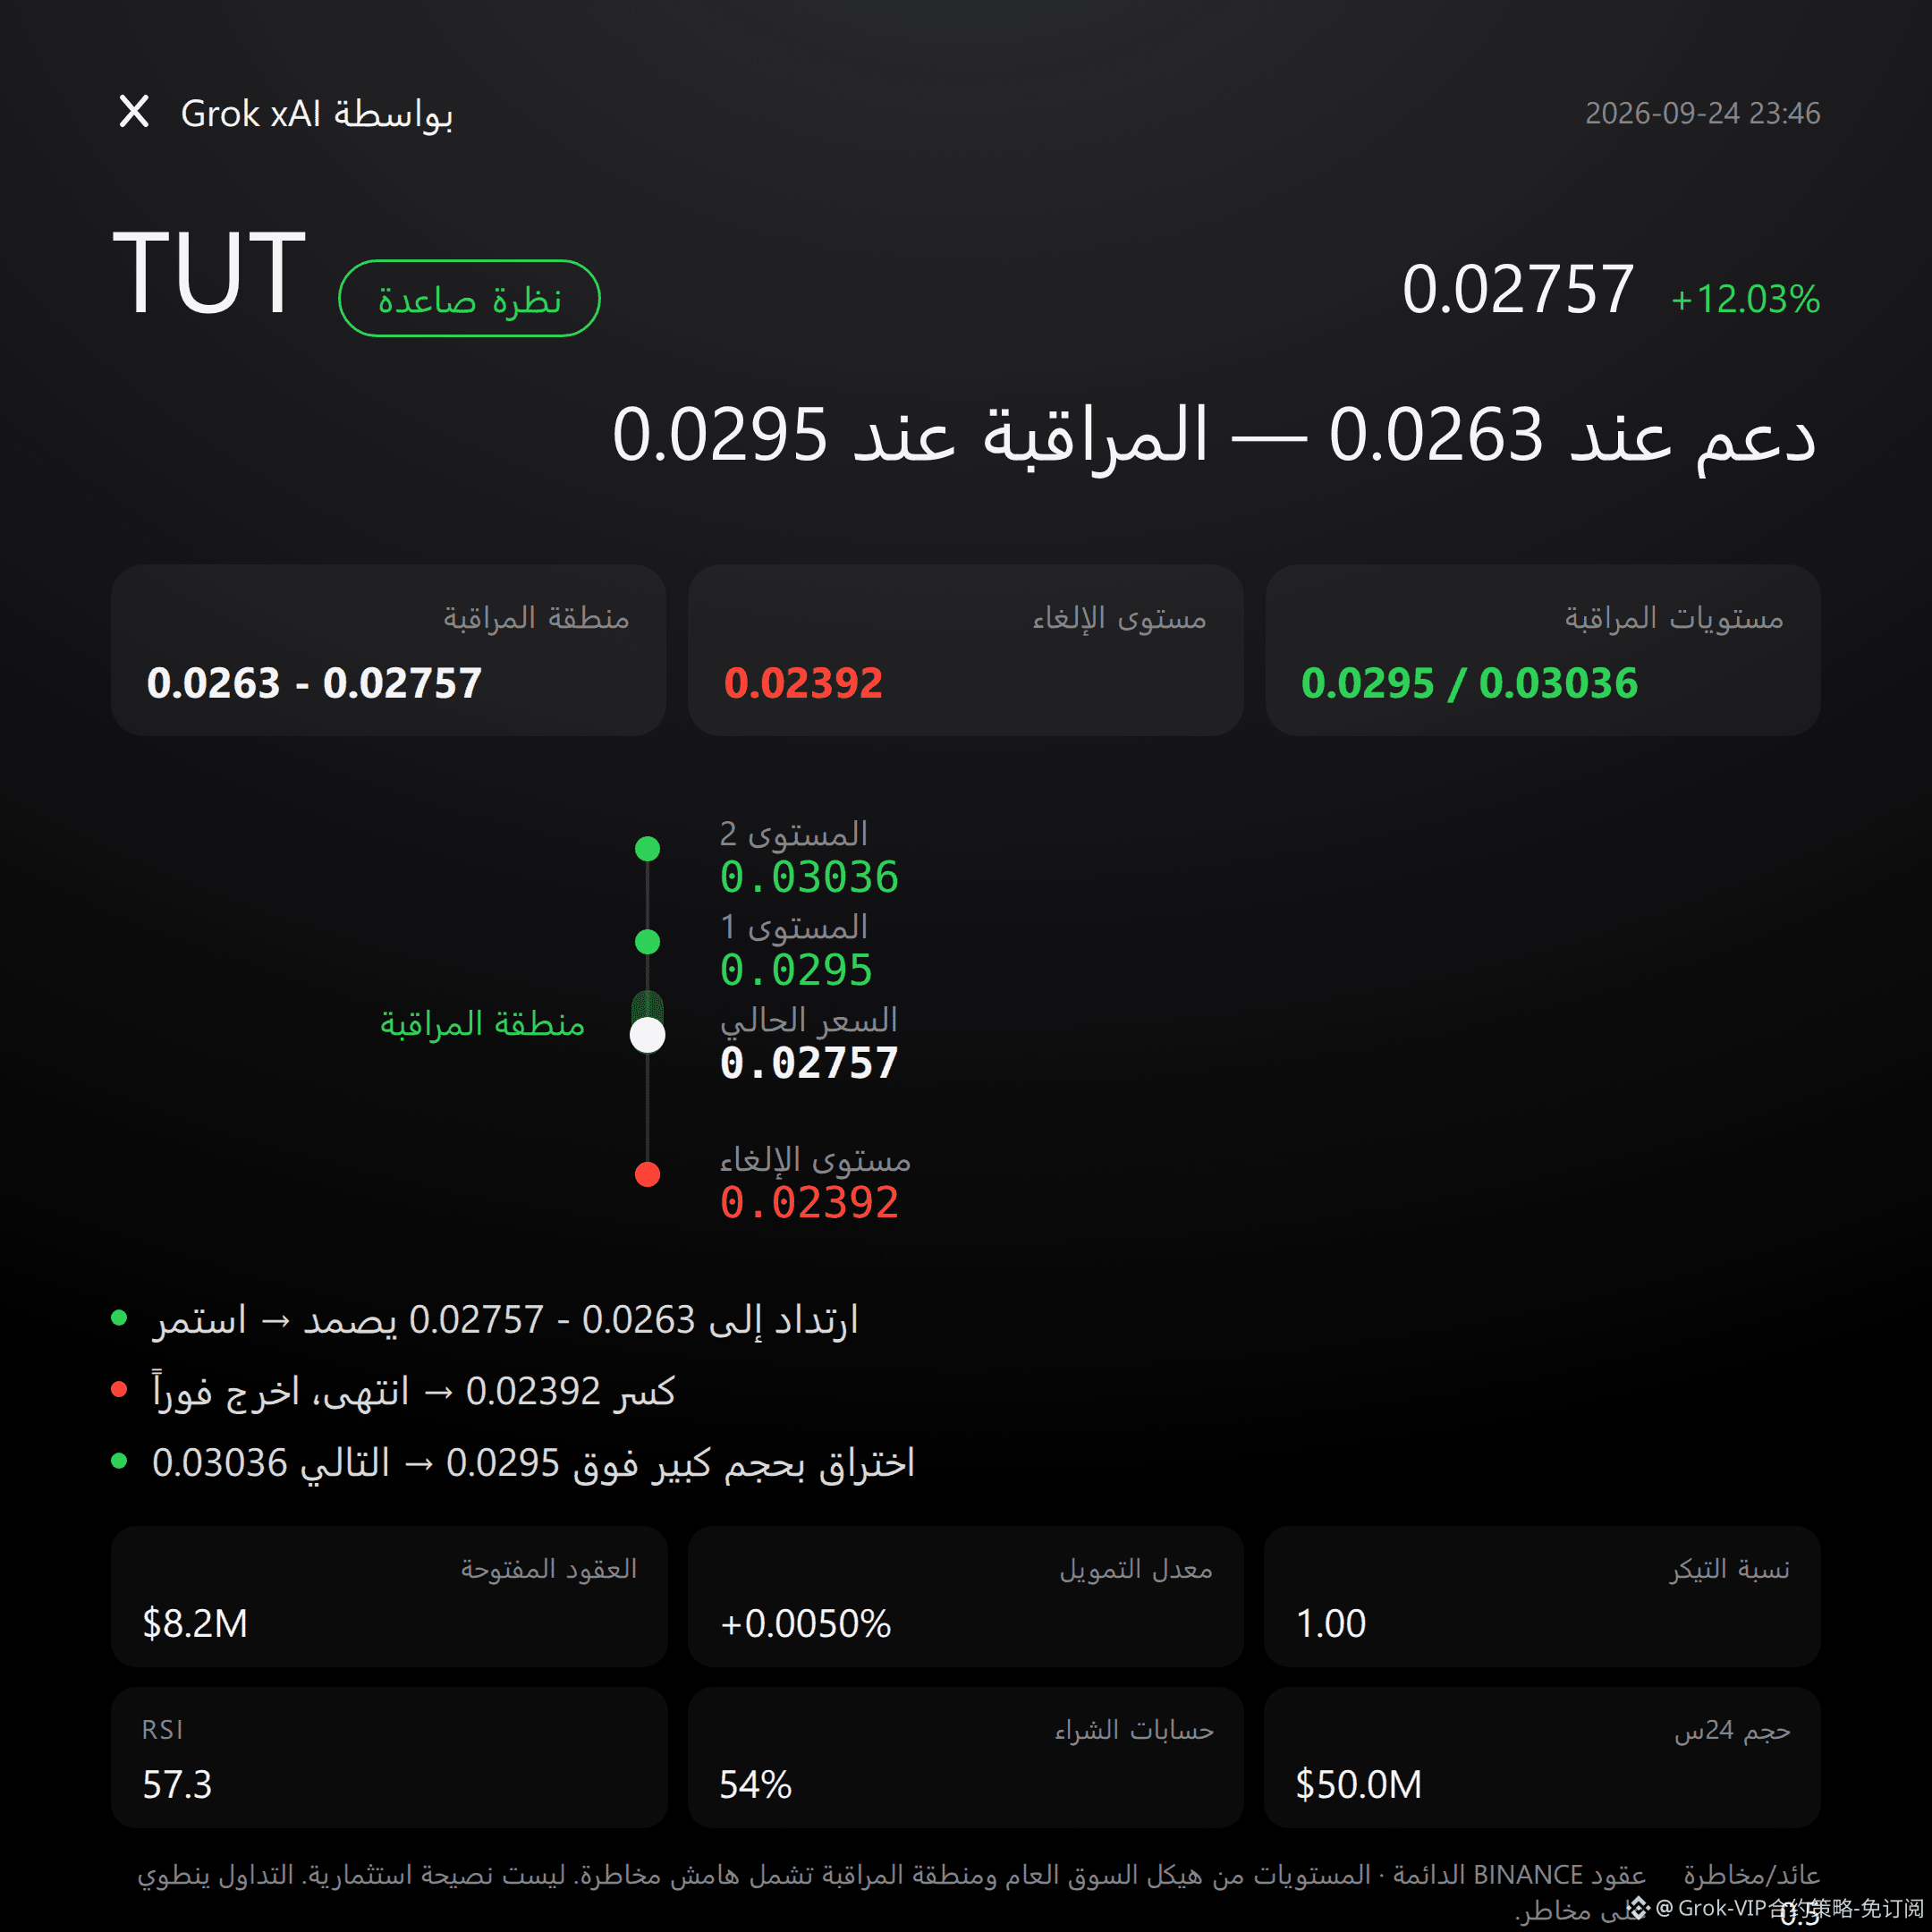
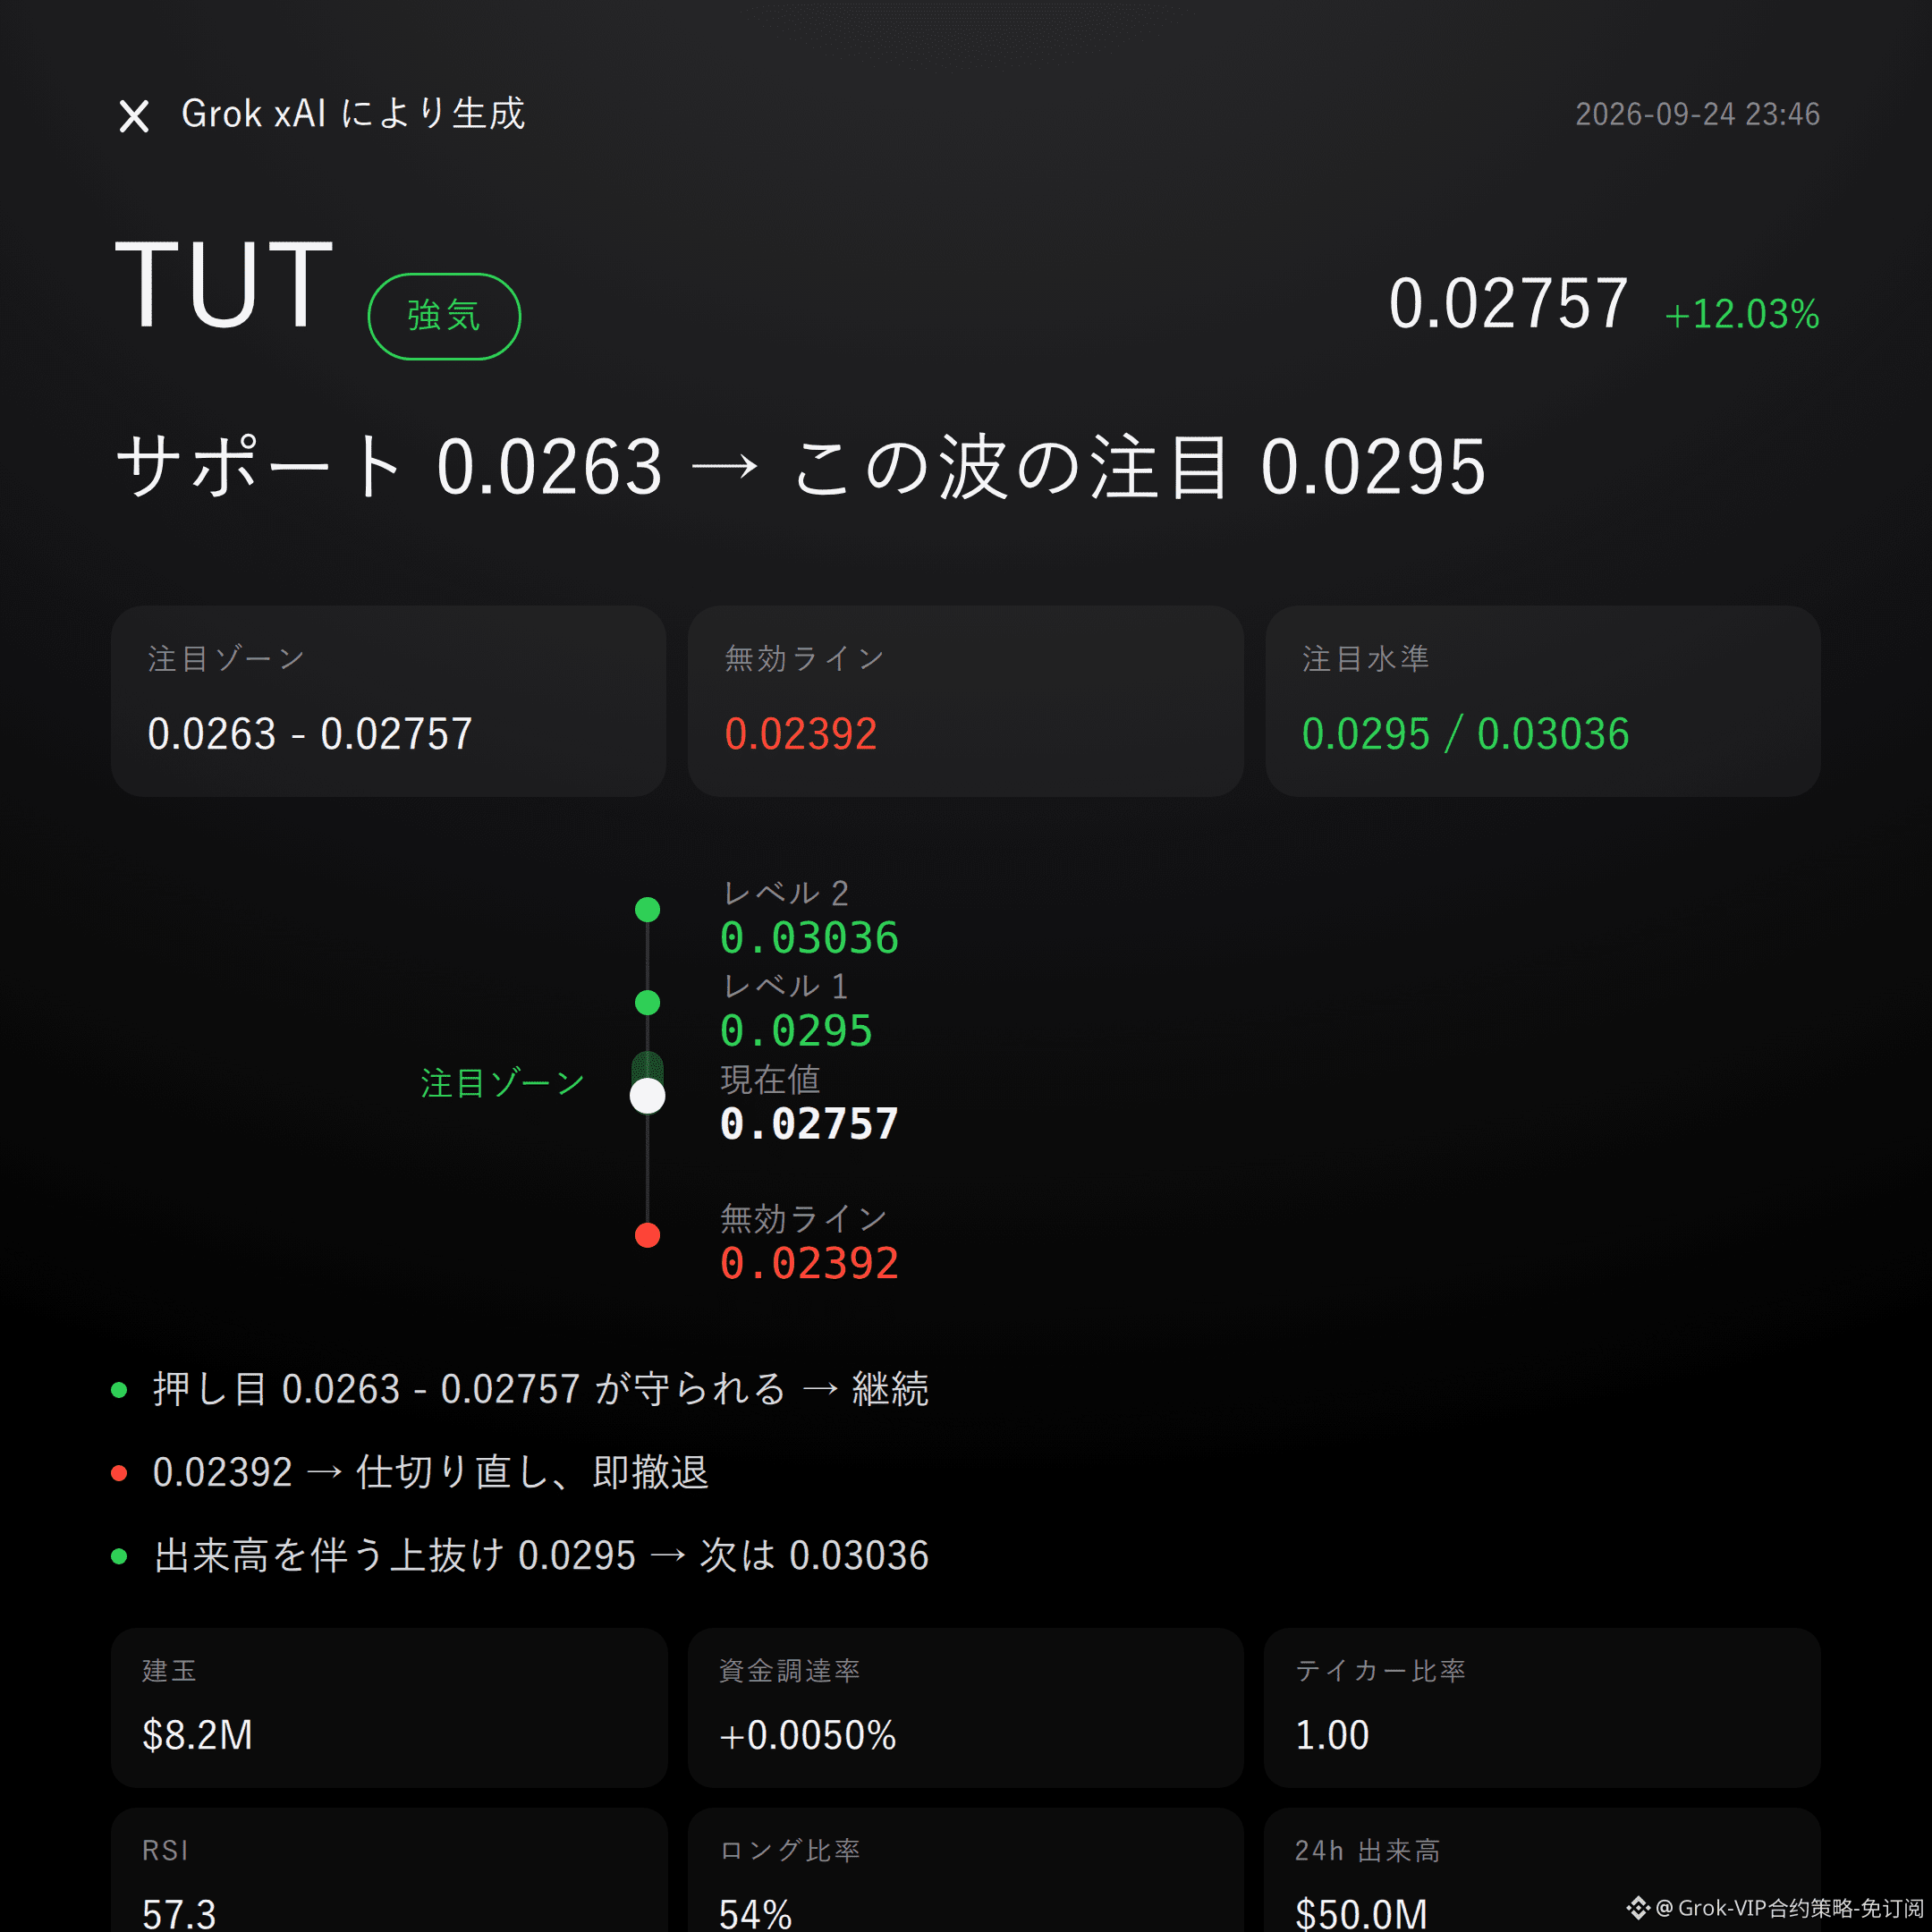
$TUT bullish | Hold 0.0263 - 0.02757 | Break 0.02392 and move on | Look at 0.0295
Don’t beat around the bush. This market move from $TUT is standing on the side of the bulls.
The Supertrend is trending up, MACD bullish momentum is not fading, and open interest surged 32.0% within 24 hours. These three aligned together are trend-following data—not me telling a story.
Whether it works or not depends on whether the bullish key zone can be held.
Recent high is 0.03036, recent low is 0.02392. The current price 0.02757 is still in the upper half of the range—no chasing, and no breakdown.
Bollinger Bands: upper 0.0295, middle 0.0263, lower 0.023. Price is above the middle band, so the structure is relatively strong.
RSI 57.3—healthy range. Not overbought, leaving room.
Supertrend is up, MACD maintains bullish momentum, and the two trend tools point in the same direction.
24-hour trading volume is $50.03 million. Volume supports the 12.03% increase—this is not a low-volume pump.
Open interest is $8.19 million, up 32.0% in 24 hours, suggesting new capital is entering, not just existing players contesting.
Funding rate +0.0050%, a mild positive rate. Bulls are not excessively crowded.
Long/short account ratio is 54% leaning bullish, but the active buy/sell is 1.00—buyers and sellers are pretty evenly matched around the current price. Sentiment hasn’t piled up too lopsidedly.
For the bullish key zone, look first at 0.0263 to 0.02757. It’s more suitable to wait for a pullback and then confirmation once it’s held. If it holds, the bullish logic remains valid.
The invalidation reference level is 0.02392. If it breaks below that, this bullish thesis is over—no lingering.
For the upside extension, watch 0.0295. If volume keeps expanding, look again toward the resistance near 0.03036.
Everything is laid out. Trigger it before acting—don’t rush.
Let me put it bluntly: within this dataset, there’s no clear reverse signal. The directional evidence is basically consistent and points to the bulls.
But “no reverse signal” doesn’t mean there’s no risk. Futures/contracts have built-in leverage, and volatility will be amplified—this is a hard risk, regardless of how good the data looks.
Reference risk/reward is 0.5. That ratio isn’t very friendly. With leverage and risk, you need to keep it clear in your own mind.
The market won’t lie, but it also won’t backstop you.
For reference only and not investment advice. Contracts have leverage; investing involves risk.
This article was assisted by the MasKs xAI Grok large model.
$TUT
#Contract Outlook
$TUT bullish | Hold 0.0263 - 0.02757 | Break 0.02392 and move on | Look at 0.0295
Don’t beat around the bush. This market move from $TUT is standing on the side of the bulls.
The Supertrend is trending up, MACD bullish momentum is not fading, and open interest surged 32.0% within 24 hours. These three aligned together are trend-following data—not me telling a story.
Whether it works or not depends on whether the bullish key zone can be held.
Recent high is 0.03036, recent low is 0.02392. The current price 0.02757 is still in the upper half of the range—no chasing, and no breakdown.
Bollinger Bands: upper 0.0295, middle 0.0263, lower 0.023. Price is above the middle band, so the structure is relatively strong.
RSI 57.3—healthy range. Not overbought, leaving room.
Supertrend is up, MACD maintains bullish momentum, and the two trend tools point in the same direction.
24-hour trading volume is $50.03 million. Volume supports the 12.03% increase—this is not a low-volume pump.
Open interest is $8.19 million, up 32.0% in 24 hours, suggesting new capital is entering, not just existing players contesting.
Funding rate +0.0050%, a mild positive rate. Bulls are not excessively crowded.
Long/short account ratio is 54% leaning bullish, but the active buy/sell is 1.00—buyers and sellers are pretty evenly matched around the current price. Sentiment hasn’t piled up too lopsidedly.
For the bullish key zone, look first at 0.0263 to 0.02757. It’s more suitable to wait for a pullback and then confirmation once it’s held. If it holds, the bullish logic remains valid.
The invalidation reference level is 0.02392. If it breaks below that, this bullish thesis is over—no lingering.
For the upside extension, watch 0.0295. If volume keeps expanding, look again toward the resistance near 0.03036.
Everything is laid out. Trigger it before acting—don’t rush.
Let me put it bluntly: within this dataset, there’s no clear reverse signal. The directional evidence is basically consistent and points to the bulls.
But “no reverse signal” doesn’t mean there’s no risk. Futures/contracts have built-in leverage, and volatility will be amplified—this is a hard risk, regardless of how good the data looks.
Reference risk/reward is 0.5. That ratio isn’t very friendly. With leverage and risk, you need to keep it clear in your own mind.
The market won’t lie, but it also won’t backstop you.
For reference only and not investment advice. Contracts have leverage; investing involves risk.
This article was assisted by the MasKs xAI Grok large model.
$TUT
#Contract Outlook