SHORT $TIA | Hot momentum or cold momentum — read in which timeframe?
🚨 AI TRADE ALERT — $TIA
🔴 SHORT
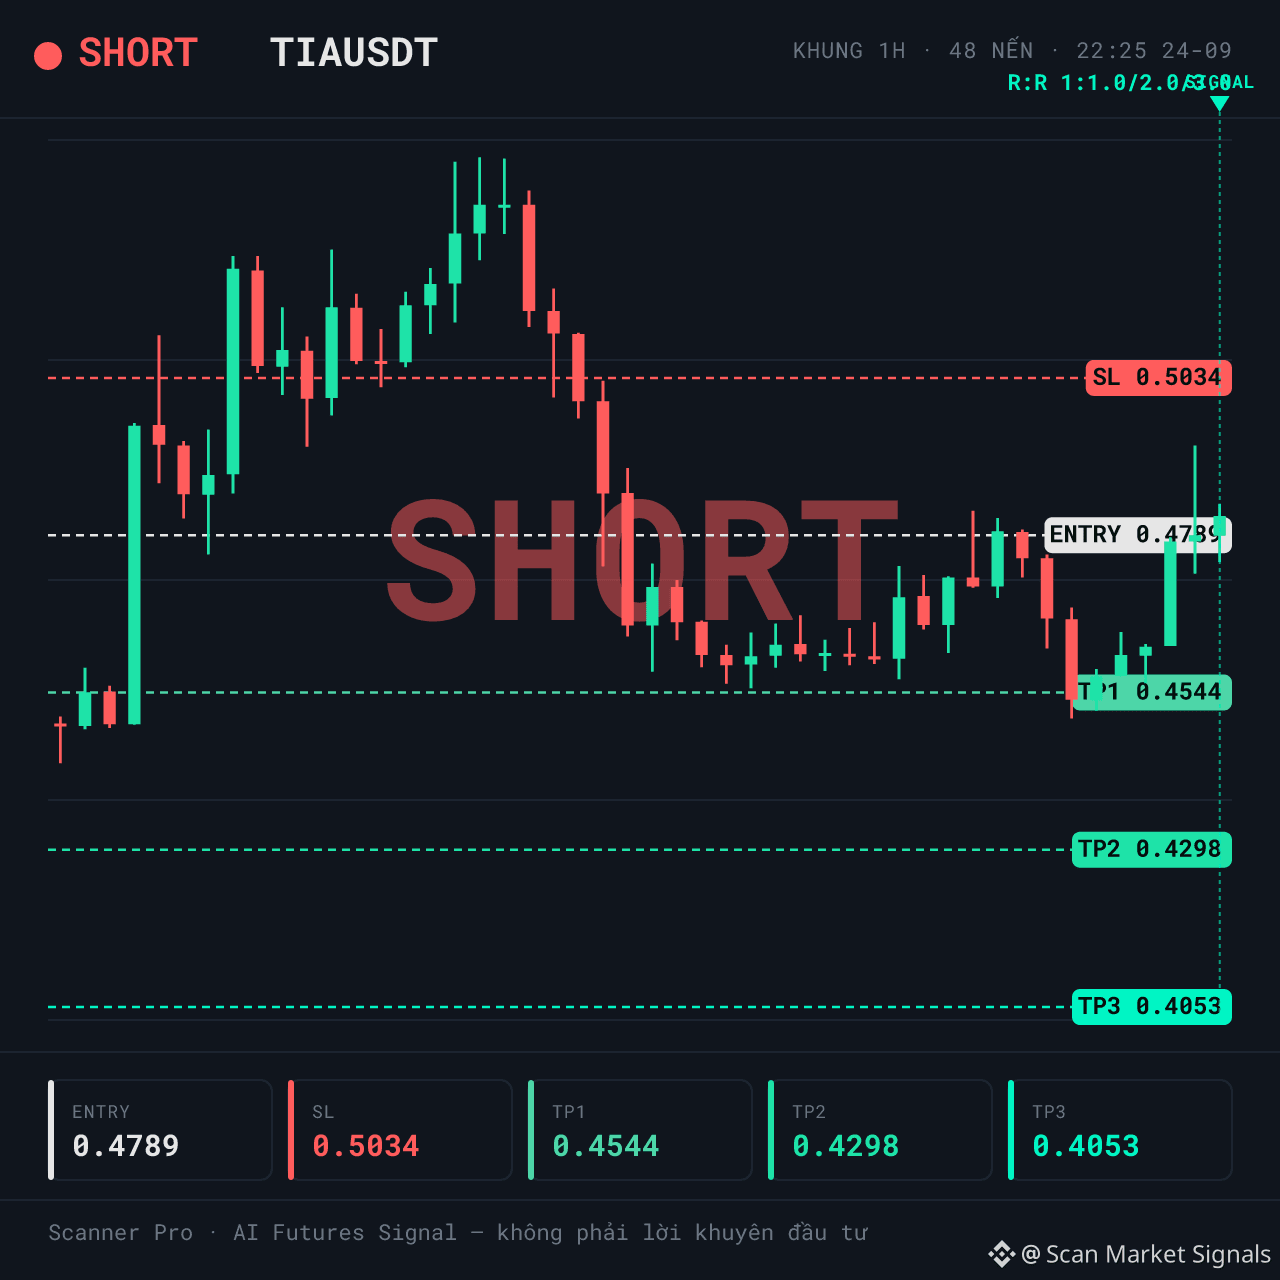
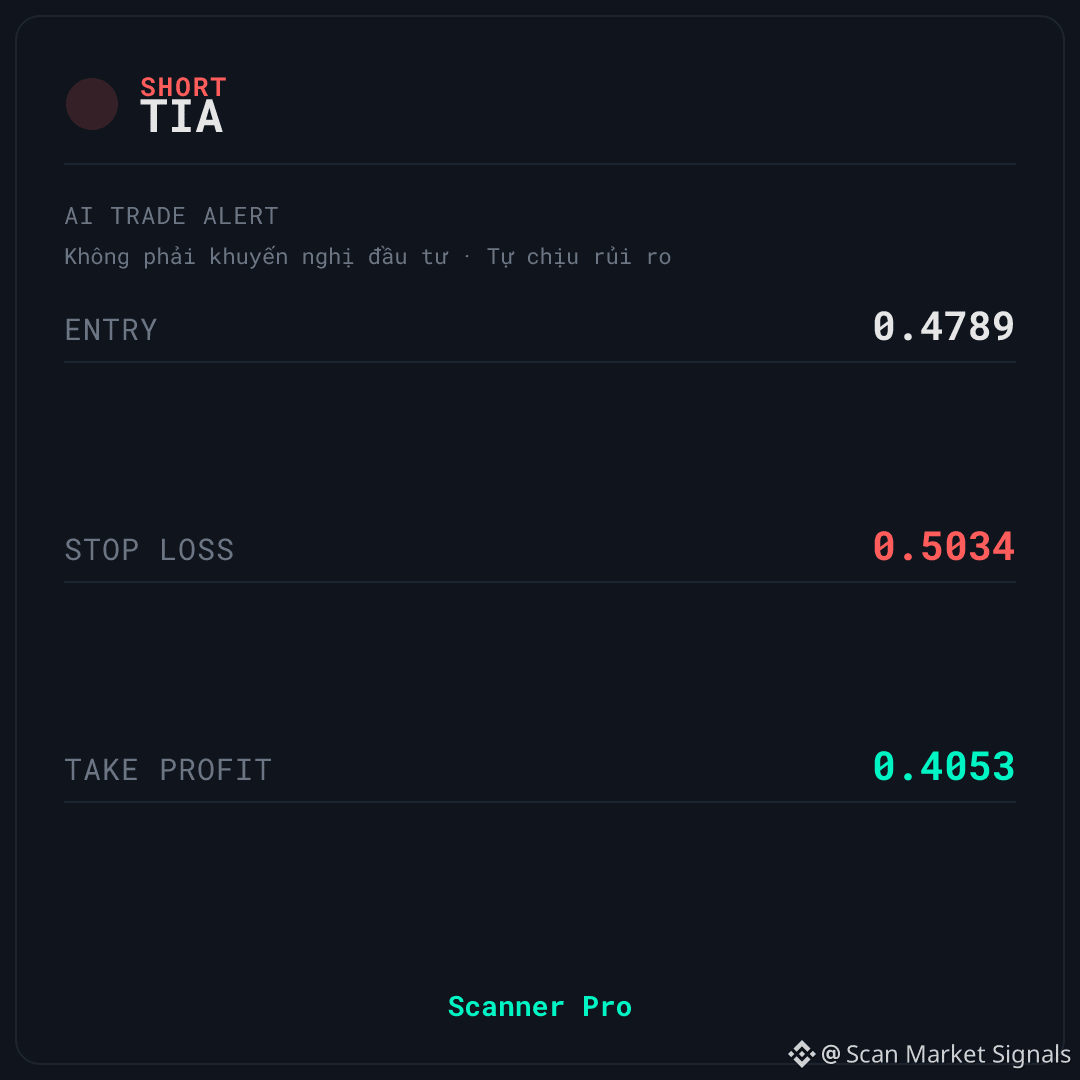
📌 Entry: 0.4782 – 0.4796
🛑 Stop Loss: 0.5034
🎯 Take Profit: 0.4053
⏰ Validity: 6 hours (22:25 on 24/09 – 04:25 on 25/09, VN time)
↔️ SIDEWAY — the market is ranging; fade signal (mean reversion)
$TIA is being monitored by Scanner Pro under the SHORT scenario when price reacts at the high end of the 24h range. The context is classified as sideways with 55% confidence; 24h volume is about 63,811,151 USDT, and the volume spike index is 0.85x.
📊 WHAT DOES THE DATA INDICATE?
The first point that could make this scenario wrong: price is still at 77% of the 24h range—i.e., the upper zone. If buying pressure holds here, the expected bearish pressure may not appear. On the flip side, funding is 0.0010%, indicating the LONG side is paying fees to the SHORT side—meaning the crowd is leaning opposite to the signal, which supports the SHORT direction. The sideways context with 55% confidence means the trend classification is not yet solid; the signal needs additional confirmation from price action. The momentum indicator on the 1h timeframe is around 57—still not in the overbought zone, so it’s not yet enough to be a major obstacle for the downside scenario.
💡 SCENARIO & OPEN QUESTION — $TIA
⚠️ Biggest conflict: this is a reversal strategy, but price is currently near the high end of the 24h range, plus the context classification only reaches 55% confidence—still not strong enough to confirm a trend. 🚫 If price closes above the stop-loss level on the signal card, the current SHORT scenario will no longer be valid. Do you think this is a real reversal signal, or just a pullback within a sideways range?
This is educational technical analysis content, not investment advice. Crypto trading carries high risk; you may lose all of your capital. Do your own research and take responsibility for your decisions.
#Binance #Crypto #Futures
🚨 AI TRADE ALERT — $TIA
🔴 SHORT
📌 Entry: 0.4782 – 0.4796
🛑 Stop Loss: 0.5034
🎯 Take Profit: 0.4053
⏰ Validity: 6 hours (22:25 on 24/09 – 04:25 on 25/09, VN time)
↔️ SIDEWAY — the market is ranging; fade signal (mean reversion)
$TIA is being monitored by Scanner Pro under the SHORT scenario when price reacts at the high end of the 24h range. The context is classified as sideways with 55% confidence; 24h volume is about 63,811,151 USDT, and the volume spike index is 0.85x.
📊 WHAT DOES THE DATA INDICATE?
The first point that could make this scenario wrong: price is still at 77% of the 24h range—i.e., the upper zone. If buying pressure holds here, the expected bearish pressure may not appear. On the flip side, funding is 0.0010%, indicating the LONG side is paying fees to the SHORT side—meaning the crowd is leaning opposite to the signal, which supports the SHORT direction. The sideways context with 55% confidence means the trend classification is not yet solid; the signal needs additional confirmation from price action. The momentum indicator on the 1h timeframe is around 57—still not in the overbought zone, so it’s not yet enough to be a major obstacle for the downside scenario.
💡 SCENARIO & OPEN QUESTION — $TIA
⚠️ Biggest conflict: this is a reversal strategy, but price is currently near the high end of the 24h range, plus the context classification only reaches 55% confidence—still not strong enough to confirm a trend. 🚫 If price closes above the stop-loss level on the signal card, the current SHORT scenario will no longer be valid. Do you think this is a real reversal signal, or just a pullback within a sideways range?
This is educational technical analysis content, not investment advice. Crypto trading carries high risk; you may lose all of your capital. Do your own research and take responsibility for your decisions.
#Binance #Crypto #Futures