


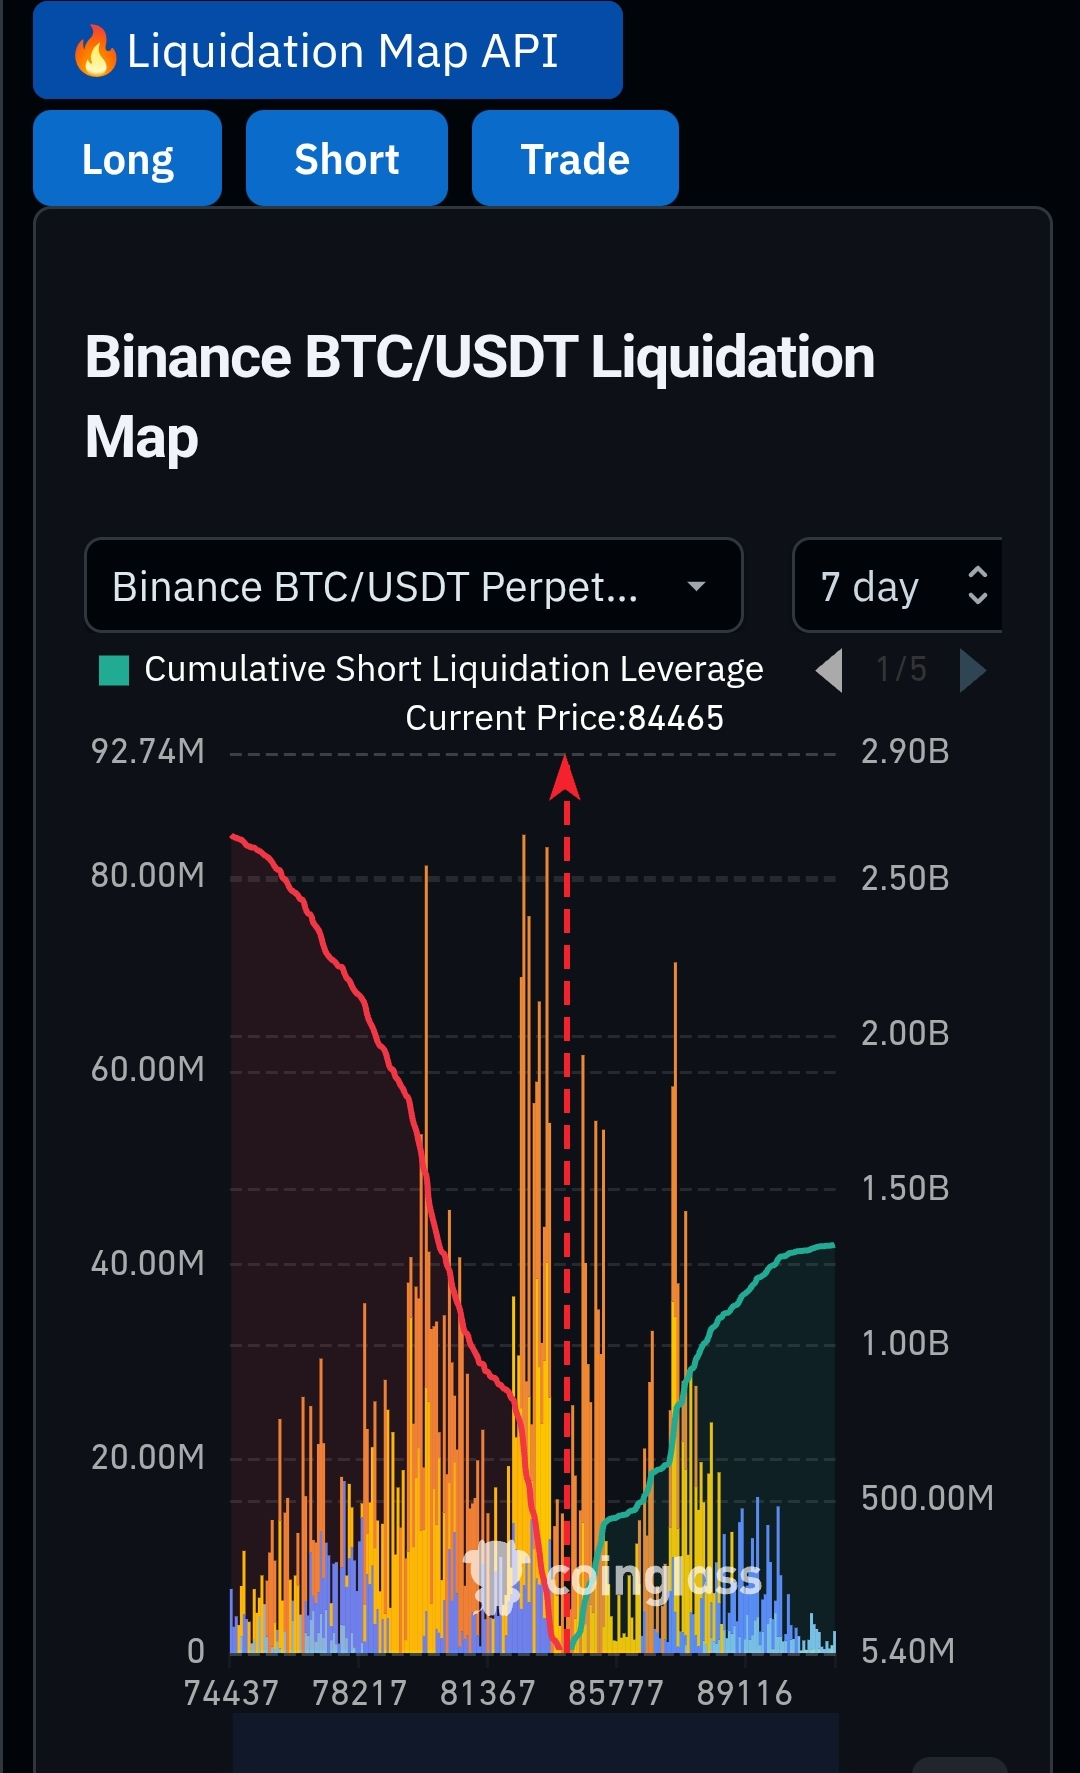
This chart is the 7-day liquidation map for Binance BTC/USDT Perpetual Futures. The screenshot shows the current Bitcoin price as 84,465 USDT. The purpose of this chart is to show which price regions are more likely to see liquidation of leveraged longs and shorts; it is not a chart that predicts exact future price. CoinGlass creates these zones based on estimates from market data, open interest, and various leverage levels. ��
Based on the main numbers shown on the chart, the chart’s price range is approximately 74,437 to 89,116 USDT. The left-side scale appears to be about 0 to 92.74M, and the right-side scale appears to be about 5.40M to 2.90B. From the current price downward, the main liquidation clusters look like this: 83,000–84,000 USDT: medium to high liquidation activity. 81,000–83,000 USDT: the most important long-liquidation area below. 78,000–81,000 USDT: more liquidation concentration with multiple orange and yellow bars. 74,500–78,000 USDT: an extended risk zone to the downside. From the current price upward, the main clusters look like this: 84,800–86,000 USDT: the nearest and notable short-liquidation area. 86,000–87,000 USDT: a significant zone with high bars. 87,500–89,000 USDT: smaller but consistent short-liquidation clusters. Above 89,000 USDT: clearer data is not shown in this screenshot. Meaning of Long and Short positions Long position: a trader holding a long position believes Bitcoin’s price will rise. If BTC falls to its liquidation price, the exchange will automatically close the position. This forced selling can push the price further downward. Short position: a trader holding a short position believes Bitcoin’s price will fall. If BTC rises and reaches its liquidation price, BTC must be bought to close the short position. This forced buying can push the price even higher. Such a fast upward move is called a short squeeze. The bars shown in CoinGlass’s heatmap do not indicate exactly how much will be liquidated; they reflect the relative intensity of liquidation. So when there is a large bar on the chart, it should mean “there is a higher chance of market reaction in this area,” not “exactly this many dollars will be liquidated.” ��
Analysis of long liquidation
The current price is 84,465 USDT, so the area below it is risky for long positions. Especially in the 81,000–83,000 USDT range, you can see multiple high bars. If BTC quickly enters this zone, the likelihood increases that high-leverage long traders’ positions will be closed. Therefore, a possible sequence could be: BTC falls below 84,465. Pressure builds on long positions around 83,000. If 81,000–82,000 breaks, more long liquidation could begin. If forced selling increases, price could move quickly toward the 78,000–80,000 area. However, that doesn’t mean BTC will definitely go to 81,000. Often, price can reach a liquidation zone and then quickly reverse back.
Analysis of short liquidation Above 84,465
The 85,000–87,000 USDT area carries significant risk for short positions. In the chart, you can see high yellow and orange bars in this region. If BTC holds above 85,000 with volume, the likelihood increases that short sellers will buy BTC to close their positions. Therefore, a possible short-squeeze sequence could be: BTC stays strongly above 84,465. The first short cluster triggers in the 85,000–86,000 range. Forced buying increases from 86,000 to 87,000. If open interest decreases and volume increases, that could be a move driven by short liquidation. If price rises but open interest also increases very quickly, it could mean new leveraged shorts or longs are being added. So it’s not appropriate to assume a short squeeze is guaranteed just because the price is rising. The most important price area: 84,465 USDT is currently a decision point. Because liquidation concentration is on both sides around this level, volatility here could increase. Key area above: 85,000–87,000 USDT.
If price breaks through this area and BTC holds there, upward acceleration could come from short liquidation. Key area below: 81,000–83,000 USDT.
If this area breaks, long liquidation could cause downward acceleration from long liquidations. Deeper downside risk: 78,000–81,000 USDT.
Many clusters also appear in this area, so if a breakdown happens below 81,000, the price could drop quickly and in a volatile manner. Possible market scenarios: If Bitcoin breaks out above 85,000 and gives a close with 15-minute or 1-hour candle volume, the short-liquidation liquidity above could be pulled. But if right after the breakout it comes back below 84,465, it could be a false breakout or a liquidity sweep. If Bitcoin moves below 83,000 and doesn’t find support there, the pressure for long liquidation toward the 81,000–82,000 area could increase. If price approaches 81,000 and quickly comes back up, it could become a reversal after long liquidation. If BTC stays between 83,000 and 85,000, liquidation clusters on both sides may keep pulling the market. In such a situation, sideways movement and sudden wicks are both possible.
Proper trading advice
It’s risky to open a long or short directly from this chart. Use the liquidation map not as an entry signal, but to identify risk and liquidity zones. Don’t trade with high leverage near 84,465. For longs, watch price action and volume confirmation below 83,000 and 81,000. For shorts, check rejection, volume, and open interest in the 85,000–87,000 area. Don’t trade just based on wicks; wait for the candle close. Analyze how price moves along with whether open interest is rising or falling. If the funding rate is very positive, it can indicate long crowding; if it’s very negative, it can indicate short crowding. Don’t trade futures without a stop-loss. In a single trade, don’t risk more than a small portion of total trading capital. Don’t ignore news, macroeconomic data, and US market volatility. Don’t treat the estimated values on the liquidation map as exact position values, because these are modeled estimates and not exchange-confirmed liquidation records. �
Final conclusion
The most important message of this chart is that Bitcoin is in a two-sided liquidation zone around 84,465 USDT. Above 85,000–87,000 USDT there is short-liquidation risk, while below 81,000–83,000 USDT there is long-liquidation risk. In my view, in this situation, a confirmation-based approach is more appropriate than choosing direction immediately. A durable breakout with volume above 85,000 could point toward a bullish short-squeeze, while a breakdown below 83,000—especially below 81,000—could point toward a long-liquidation cascade. However, this chart alone isn’t sufficient; decisions should be made together with price action, volume, open interest, and the funding rate.
Disclaimer: do not agree with me; do your own research and risk.