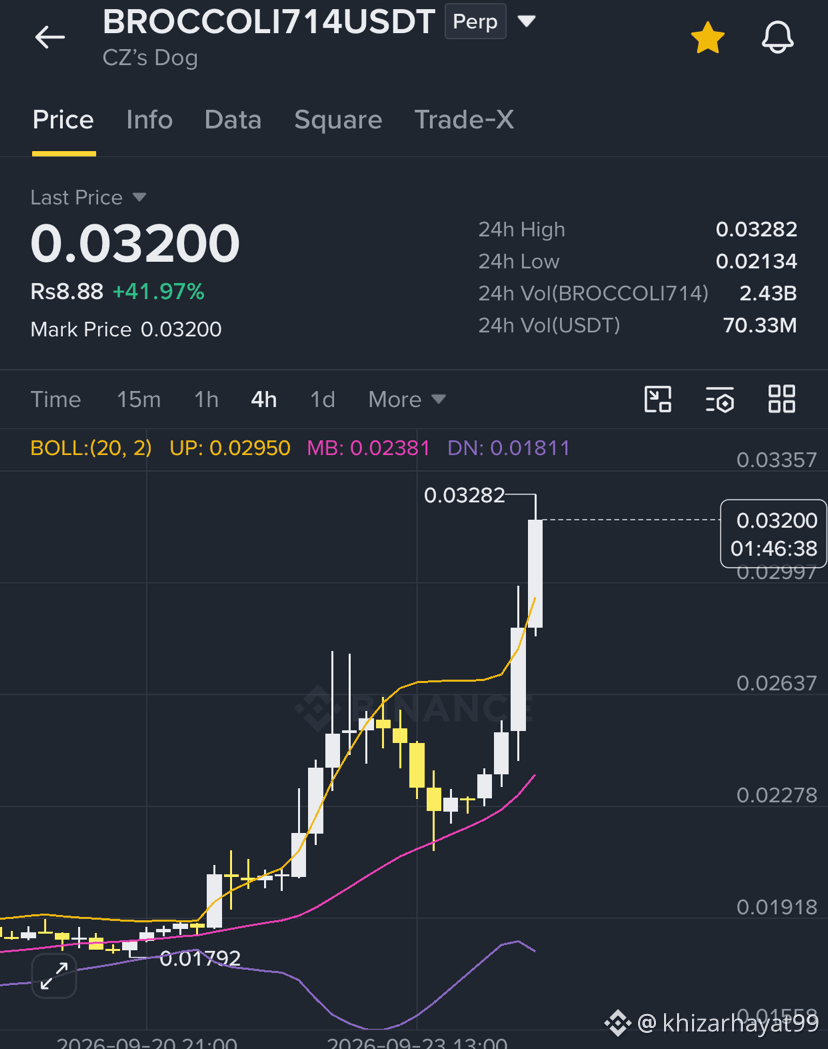
Analyzing the 4-hour (4H) chart structure for $BROCCOLI714/USDT with an eye toward a bullish setup near the 0.032 level requires strict risk management, especially given the high volatility typical of altcoin and memetic market structures.
Disclaimer: The following breakdown is for educational and informational purposes based on technical chart structure and does not constitute financial advice.
📊 Technical Structure Overview
When evaluating a potential continuation or bounce setup at a specific structural inflection point like 0.032 on a 4H timeframe, look for the following confluence factors:
Market Structure Shift (MSS): Confirmation that the lower-timeframe bearish retracement has broken and the 4H higher-low (HL) sequence is intact.
Demand Zone Confluence: Checking whether 0.032 aligns with a previous 4H resistance-turned-support (R/S flip), a local order block (OB), or a key Fibonacci retracement level (typically the 0.5 to 0.618 golden pocket).
Volume Profile: Bullish setups are higher-probability when local pullbacks to support occur on diminishing volume, followed by an expansion of volume on the ensuing green candles.
🛠️ Actionable Setup Framework
If you are tracking a long setup around this structural region, a structured execution plan helps manage downside risk:
Entry Zone: Look for confirmation candles (such as a 4H bullish engulfing or a strong pin bar rejection) near the 0.032 demand pocket rather than blindly market-ordering.
Stop Loss (Risk Protection): Place your stop loss safely beneath the most recent 4H swing low or structural invalidation point (typically 3% to 5% lower, depending on your risk tolerance) to avoid getting wicked out by normal market noise.
Take-Profit Targets:
Target 1: Previous local range high / minor resistance structure (+5% to +8% gain).
Target 2: Major 4H swing high objective for a risk-to-reward ratio exceeding 1:2 or 1:3.
What specific indicator or confluence tool (e.g., RSI divergence, moving averages, or volume profiles) are you using to validate this 4H setup?
Disclaimer: The following breakdown is for educational and informational purposes based on technical chart structure and does not constitute financial advice.
📊 Technical Structure Overview
When evaluating a potential continuation or bounce setup at a specific structural inflection point like 0.032 on a 4H timeframe, look for the following confluence factors:
Market Structure Shift (MSS): Confirmation that the lower-timeframe bearish retracement has broken and the 4H higher-low (HL) sequence is intact.
Demand Zone Confluence: Checking whether 0.032 aligns with a previous 4H resistance-turned-support (R/S flip), a local order block (OB), or a key Fibonacci retracement level (typically the 0.5 to 0.618 golden pocket).
Volume Profile: Bullish setups are higher-probability when local pullbacks to support occur on diminishing volume, followed by an expansion of volume on the ensuing green candles.
🛠️ Actionable Setup Framework
If you are tracking a long setup around this structural region, a structured execution plan helps manage downside risk:
Entry Zone: Look for confirmation candles (such as a 4H bullish engulfing or a strong pin bar rejection) near the 0.032 demand pocket rather than blindly market-ordering.
Stop Loss (Risk Protection): Place your stop loss safely beneath the most recent 4H swing low or structural invalidation point (typically 3% to 5% lower, depending on your risk tolerance) to avoid getting wicked out by normal market noise.
Take-Profit Targets:
Target 1: Previous local range high / minor resistance structure (+5% to +8% gain).
Target 2: Major 4H swing high objective for a risk-to-reward ratio exceeding 1:2 or 1:3.
What specific indicator or confluence tool (e.g., RSI divergence, moving averages, or volume profiles) are you using to validate this 4H setup?