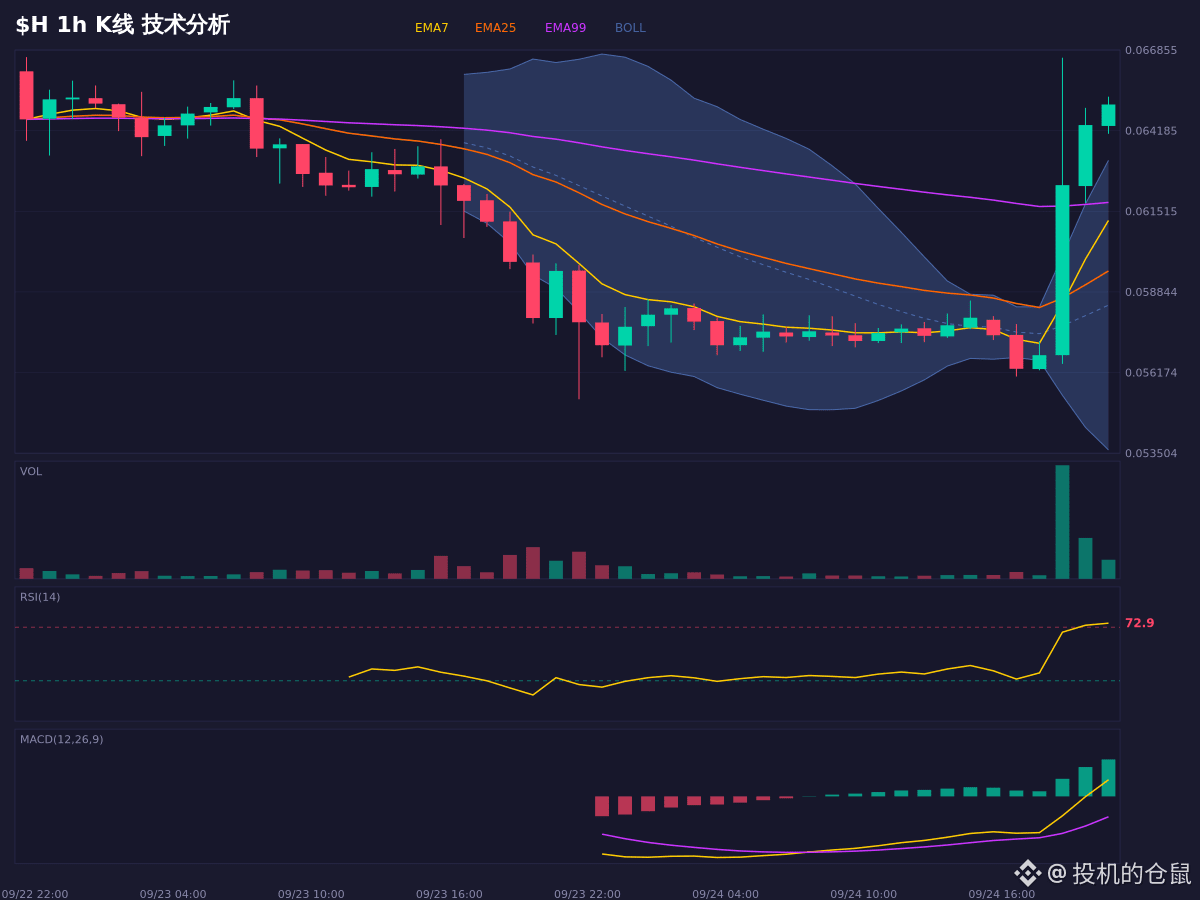
Doing technical analysis is most annoying when you get this kind of extremely overbought yet suddenly skyrocketing situation—feels like gambling.
Looking at this market move of $H , the most striking part is that the 1H RSI has surged to 72.4, but the 4H is only 45.5—short-term is overbought, yet there’s still room in the medium term. After the Bollinger Bands break above the upper band, the price has been trading above the upper band. After such a strong breakout, it’s usually followed by a pullback to test the mid-band.
The contradiction is that Stoch RSI is at double 100, which is severely overbought, but the MACD bullish momentum is still expanding. This suggests there may be a short-term pullback, but the trend hasn’t finished yet.
If it holds above the 0.060945 area, the bullish structure may continue; if it breaks below 0.058618, the current logic is invalid. The previous high at 0.066467 will form the first resistance.
Only for chart observation and scenario projection; not a record of any trading action.
$H #牛市 #永续合约 #bear market
Looking at this market move of $H , the most striking part is that the 1H RSI has surged to 72.4, but the 4H is only 45.5—short-term is overbought, yet there’s still room in the medium term. After the Bollinger Bands break above the upper band, the price has been trading above the upper band. After such a strong breakout, it’s usually followed by a pullback to test the mid-band.
The contradiction is that Stoch RSI is at double 100, which is severely overbought, but the MACD bullish momentum is still expanding. This suggests there may be a short-term pullback, but the trend hasn’t finished yet.
If it holds above the 0.060945 area, the bullish structure may continue; if it breaks below 0.058618, the current logic is invalid. The previous high at 0.066467 will form the first resistance.
Only for chart observation and scenario projection; not a record of any trading action.
$H #牛市 #永续合约 #bear market