

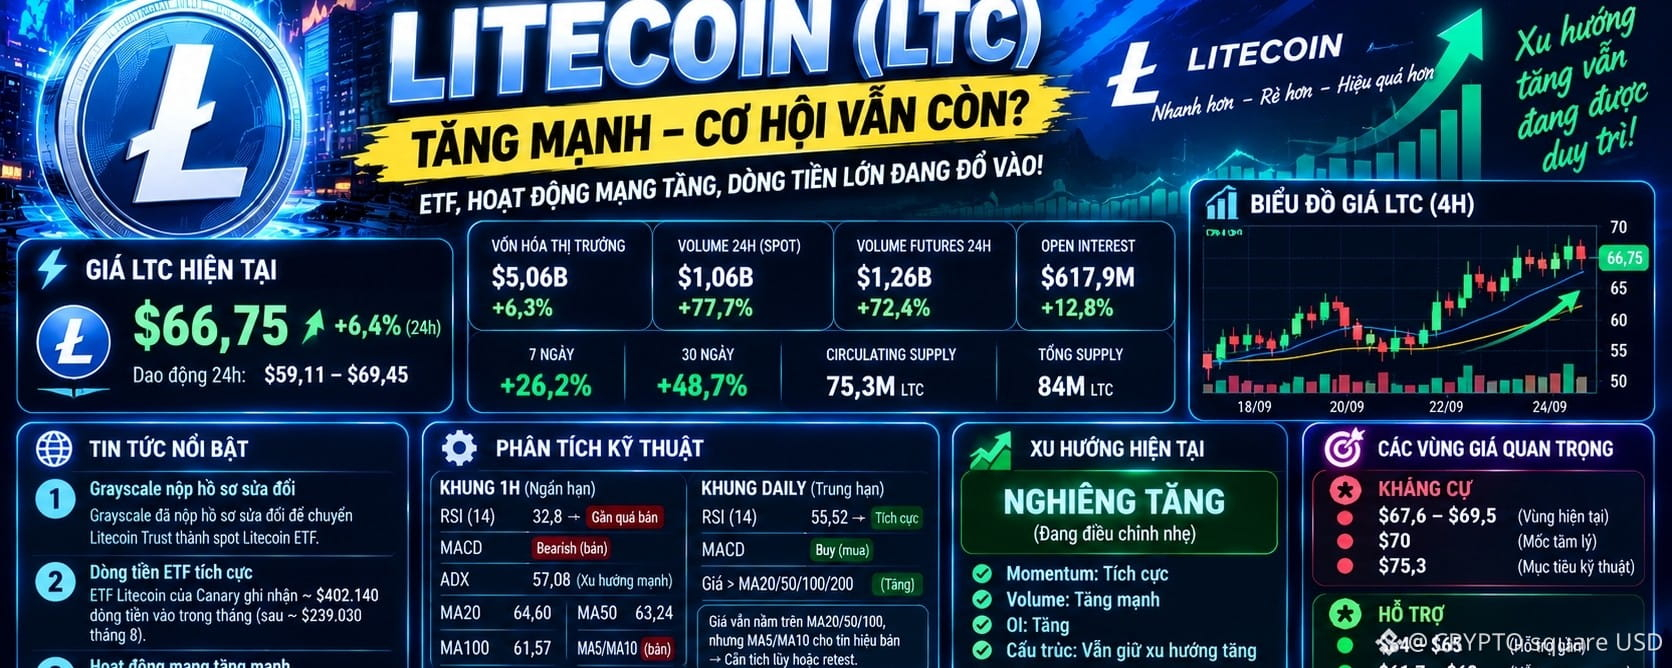

⚡ LTC — latest update & trend analysis Scan time: 24/09/2026. The price data I just accessed is currently ranging around $66.7–$69, depending on the exchange and the update time. CoinGecko records $66.75, +6.4%/24h; the daily range is $59.11–$69.45.
📊 Market data
Index Current
LTC ~$66.75–67.9
24H About +5.8–6.4%
7 days +26.2%
Spot volume 24H ~$1.06B
Futures volume 24H ~$1.26B
Open Interest ~$617.9M
24H range $59.11–$69.45. Volume is rising strongly: CoinGecko reports 24H volume increased by about 77.7% compared to the previous day, while CoinGlass reports futures volume around $1.26B and OI around $617.9M.
🔥 News is impacting LTC
1. Strong network activity
About $1 billion worth of LTC has been moved on-chain in one day, amid a strong price rally. This is a sign that on-chain activity is increasing, but the act of moving coins does not automatically mean that the entire amount is incoming buy flow.
2. ETF catalyst
Grayscale has filed a revised application to convert the Litecoin Trust into a spot Litecoin ETF; this continues to be one of the biggest narratives supporting LTC.
In addition, today’s reported data shows that Canary’s Litecoin ETF had about $402,140 in inflows during the month, after about $239,030 in outflows in August.
📈 Trend analysis
Short-term timeframe: leaning bullish, but overheated.
Investing.com at 12:12 GMT on 24/9 says:
RSI(14): 55.52 → not yet overbought.
MACD: Buy.
ADX: 57.08 → the current trend has strength.
MA20: 64.60
MA50: 63.24
MA100: 61.57
MA5/MA10 is in a short-term sell condition.
Even a Binance snapshot at 09:23 GMT showed RSI at 64.48, MACD Buy, and ADX 69.59; this indicates LTC has strong momentum, but indicator data changes by exchange and time.
Notable point: price is still above the MA20/50/100 → the short- to mid-term structure remains bullish. However, MA5/MA10 has started giving sell signals, which aligns with the possibility that LTC needs to accumulate or retest after the fast surge.
🎯 Important price zones
Resistance:
$67.6–$69.5: extremely critical zone right now.
$70: psychological level.
$75.3: the technical target tracked by a Fibonacci analysis if the $67.65 zone is broken through and held. Support:
$64–$65: near support.
$61.7–$62: important support.
$59–$60: deeper support zone.
🟢 Bullish scenario
If LTC holds above $64–65 and breaks through $69.5–70 with volume staying high, the breakout will get further confirmation. Then you could watch the $72–75 zone.
🔴 Bearish scenario
If LTC is rejected at $69–70 and then loses $64, a retest of $61.7–62 would be notable. Losing another $59–60 would clearly weaken the short-term bullish structure.
⚠️ Current risks
LTC has risen about 26% in 7 days, with both volume and OI being large. A technical source today also noted RSI around 80, suggesting that different charts/exchanges may be significantly more overbought.
Therefore, chasing the price right near $69–70 carries higher risk than waiting for confirmation of a breakout or a retest of support.
📌 Trend conclusion
LTC current:
Momentum ↑↑ | Volume ↑↑ | OI ↑ | Structure ↑ | Overheating risk ↑
I will specifically watch $64–65 and $69.5–70. If the support zone holds and the resistance zone is broken with real volume, the uptrend will be reinforced; if it fails, a pullback move is a scenario that needs to be considered.
This is data analysis at the time of the scan, not a confirmation that LTC will definitely go up or down. #LTC $LTC
