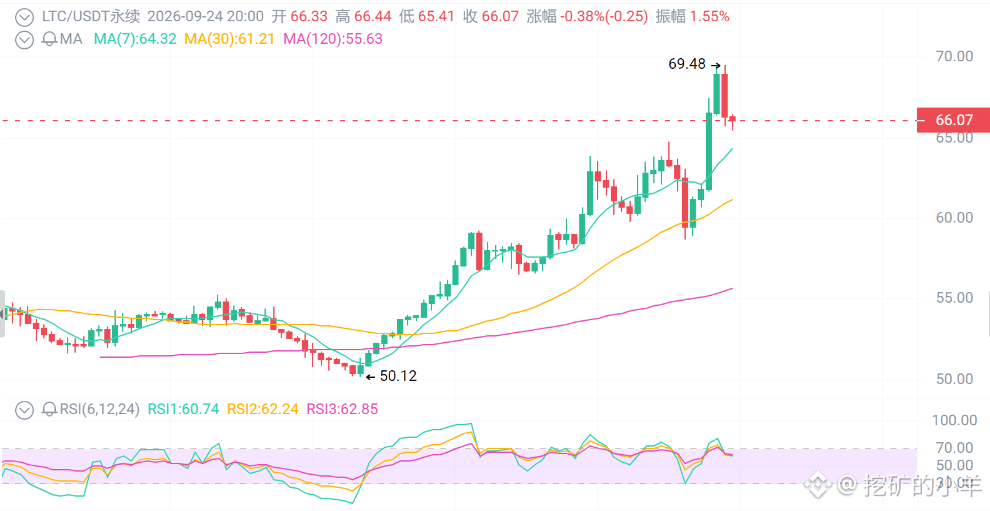
66 US dollars for LTC—dare you chase it?
First, look at the surface: the broader market is dumping, yet LTC is surging against the trend.
BTC is down to 83,000, and ETH and SOL are all kneeling, but LTC has surged from 59 to 69.5. Spot trading volume has exploded to 950 million, and perpetual OI has jumped to 500 million. The daily chart has broken through the 64–65 resistance band and is trading above all moving averages. The old-school payment coin is coming back to life—don’t miss the chance.
First thing: real on-chain activity is moving—this isn’t just wash trading.
Litecoin Foundation disclosed that after adjusting for daily changes, economic transaction value exceeds $1 billion, and about 17 million LTC have been transferred on-chain, a very high proportion of circulating supply.
Spot volume is 3x larger than on September 18; perpetual OI is rising in sync—spot accumulation plus leveraged entries, a classic “capital ignition.”
Second thing: ETF expectations are being priced in quietly.
Grayscale is pushing to convert the LTC Trust into a spot ETF (LTCN/NYSE Arca). Canary’s LTC ETF also saw net inflows in September. Fidelity Digital Assets emphasized that LTC blocks are faster and more suitable for payments.
TC is now “digital silver.” Once an ETF lands and institutional money pours in, valuations will be repriced immediately.
Third thing: the halving window—countdown has started.
LTC total supply is 84 million; circulating supply is 77.64 million; 92.4% has already been mined. The next halving is around July 2027, when the reward drops from 6.25 to 3.125.
Historical experience: 6–12 months before a halving, funds tend to price it in early. We’re exactly entering that window now. Market cap is only $5.2 billion, ranking around the low 20s—LTC is relatively “cheap” compared to BTC/ETH like vegetables.
Resistance levels: 69–71 (today’s high + a round-number barrier) → 74–76
Support levels: 64.5–65.5 (breakout retest) → 61–62.5 (the platform where it started this morning) → 58–59 (trend defense)
Trading strategy
For short-term traders:
Wait for a pullback to 64.5–65.5 to enter; stop loss at 61 (if the daily closes below, exit). First target: 69–71—take half off there. If price struggles above 69 and the 4-hour chart shows a long upper wick, consider a small position short with a target back to 65–66. If it holds above 71 with increased volume, immediately admit the mistake and exit.
For swing traders:
Wait for a daily close above 64 before getting on. The better dip-buy zone is 61.8–62.8. Targets: 74–76—use dynamic take-profit to hold.
For long-term believers:
Invest via dollar-cost averaging with no hesitation below 60, betting on ETF approval landing and sustained capital inflows before the halving. The target is looking at 100+—but remember: the halving is in 2027, so don’t fantasize about $400 right now.
First, look at the surface: the broader market is dumping, yet LTC is surging against the trend.
BTC is down to 83,000, and ETH and SOL are all kneeling, but LTC has surged from 59 to 69.5. Spot trading volume has exploded to 950 million, and perpetual OI has jumped to 500 million. The daily chart has broken through the 64–65 resistance band and is trading above all moving averages. The old-school payment coin is coming back to life—don’t miss the chance.
First thing: real on-chain activity is moving—this isn’t just wash trading.
Litecoin Foundation disclosed that after adjusting for daily changes, economic transaction value exceeds $1 billion, and about 17 million LTC have been transferred on-chain, a very high proportion of circulating supply.
Spot volume is 3x larger than on September 18; perpetual OI is rising in sync—spot accumulation plus leveraged entries, a classic “capital ignition.”
Second thing: ETF expectations are being priced in quietly.
Grayscale is pushing to convert the LTC Trust into a spot ETF (LTCN/NYSE Arca). Canary’s LTC ETF also saw net inflows in September. Fidelity Digital Assets emphasized that LTC blocks are faster and more suitable for payments.
TC is now “digital silver.” Once an ETF lands and institutional money pours in, valuations will be repriced immediately.
Third thing: the halving window—countdown has started.
LTC total supply is 84 million; circulating supply is 77.64 million; 92.4% has already been mined. The next halving is around July 2027, when the reward drops from 6.25 to 3.125.
Historical experience: 6–12 months before a halving, funds tend to price it in early. We’re exactly entering that window now. Market cap is only $5.2 billion, ranking around the low 20s—LTC is relatively “cheap” compared to BTC/ETH like vegetables.
Resistance levels: 69–71 (today’s high + a round-number barrier) → 74–76
Support levels: 64.5–65.5 (breakout retest) → 61–62.5 (the platform where it started this morning) → 58–59 (trend defense)
Trading strategy
For short-term traders:
Wait for a pullback to 64.5–65.5 to enter; stop loss at 61 (if the daily closes below, exit). First target: 69–71—take half off there. If price struggles above 69 and the 4-hour chart shows a long upper wick, consider a small position short with a target back to 65–66. If it holds above 71 with increased volume, immediately admit the mistake and exit.
For swing traders:
Wait for a daily close above 64 before getting on. The better dip-buy zone is 61.8–62.8. Targets: 74–76—use dynamic take-profit to hold.
For long-term believers:
Invest via dollar-cost averaging with no hesitation below 60, betting on ETF approval landing and sustained capital inflows before the halving. The target is looking at 100+—but remember: the halving is in 2027, so don’t fantasize about $400 right now.