1h bullish stack and daily trend are both stacked bullish on BR.
Journal note: BR
$BR /USDT · Ratio: LONG · 6/12 signals in agreement
Technical conclusion: STRONG LONG. 6/12 signals in agreement, 2 signals against.
Supporting factors (6):
• Daily trend: price > EMA50 > EMA200, bullish stack
• 4h trend: price > EMA50 > EMA200, bullish stack
• 1h trend: price > EMA50 > EMA200, bullish stack
• Short-term momentum (15m): RSI z-score +2.58, latest candle +3.58%, buyers are pressing
Opposing points (2):
• 1h RSI: 41.2, bearish momentum (below 45)
• Extreme RSI within a zone: RSI z-score +2.58 in the zone, risk of fade-the-high
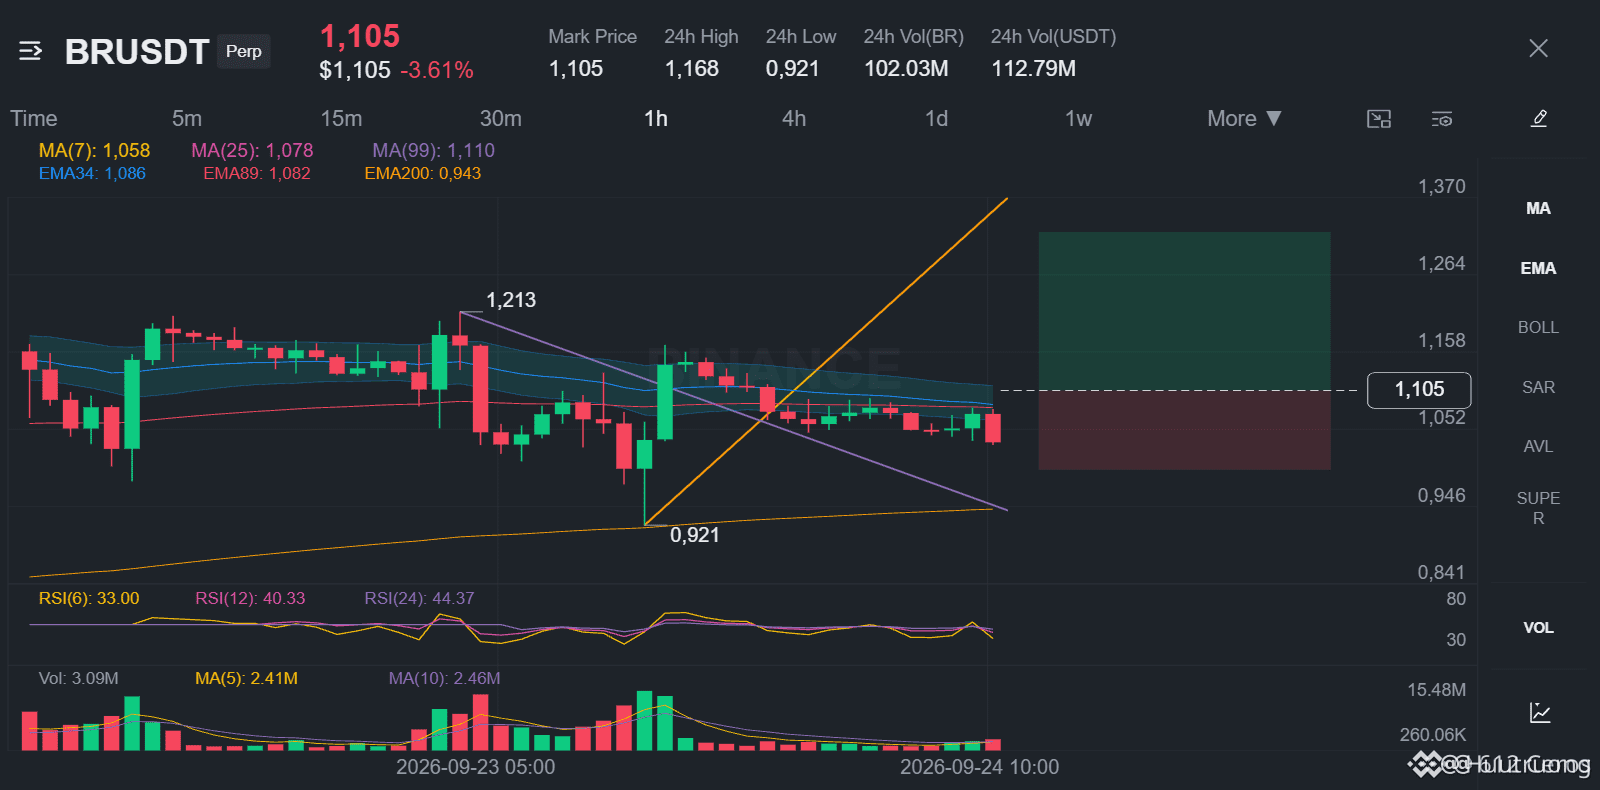
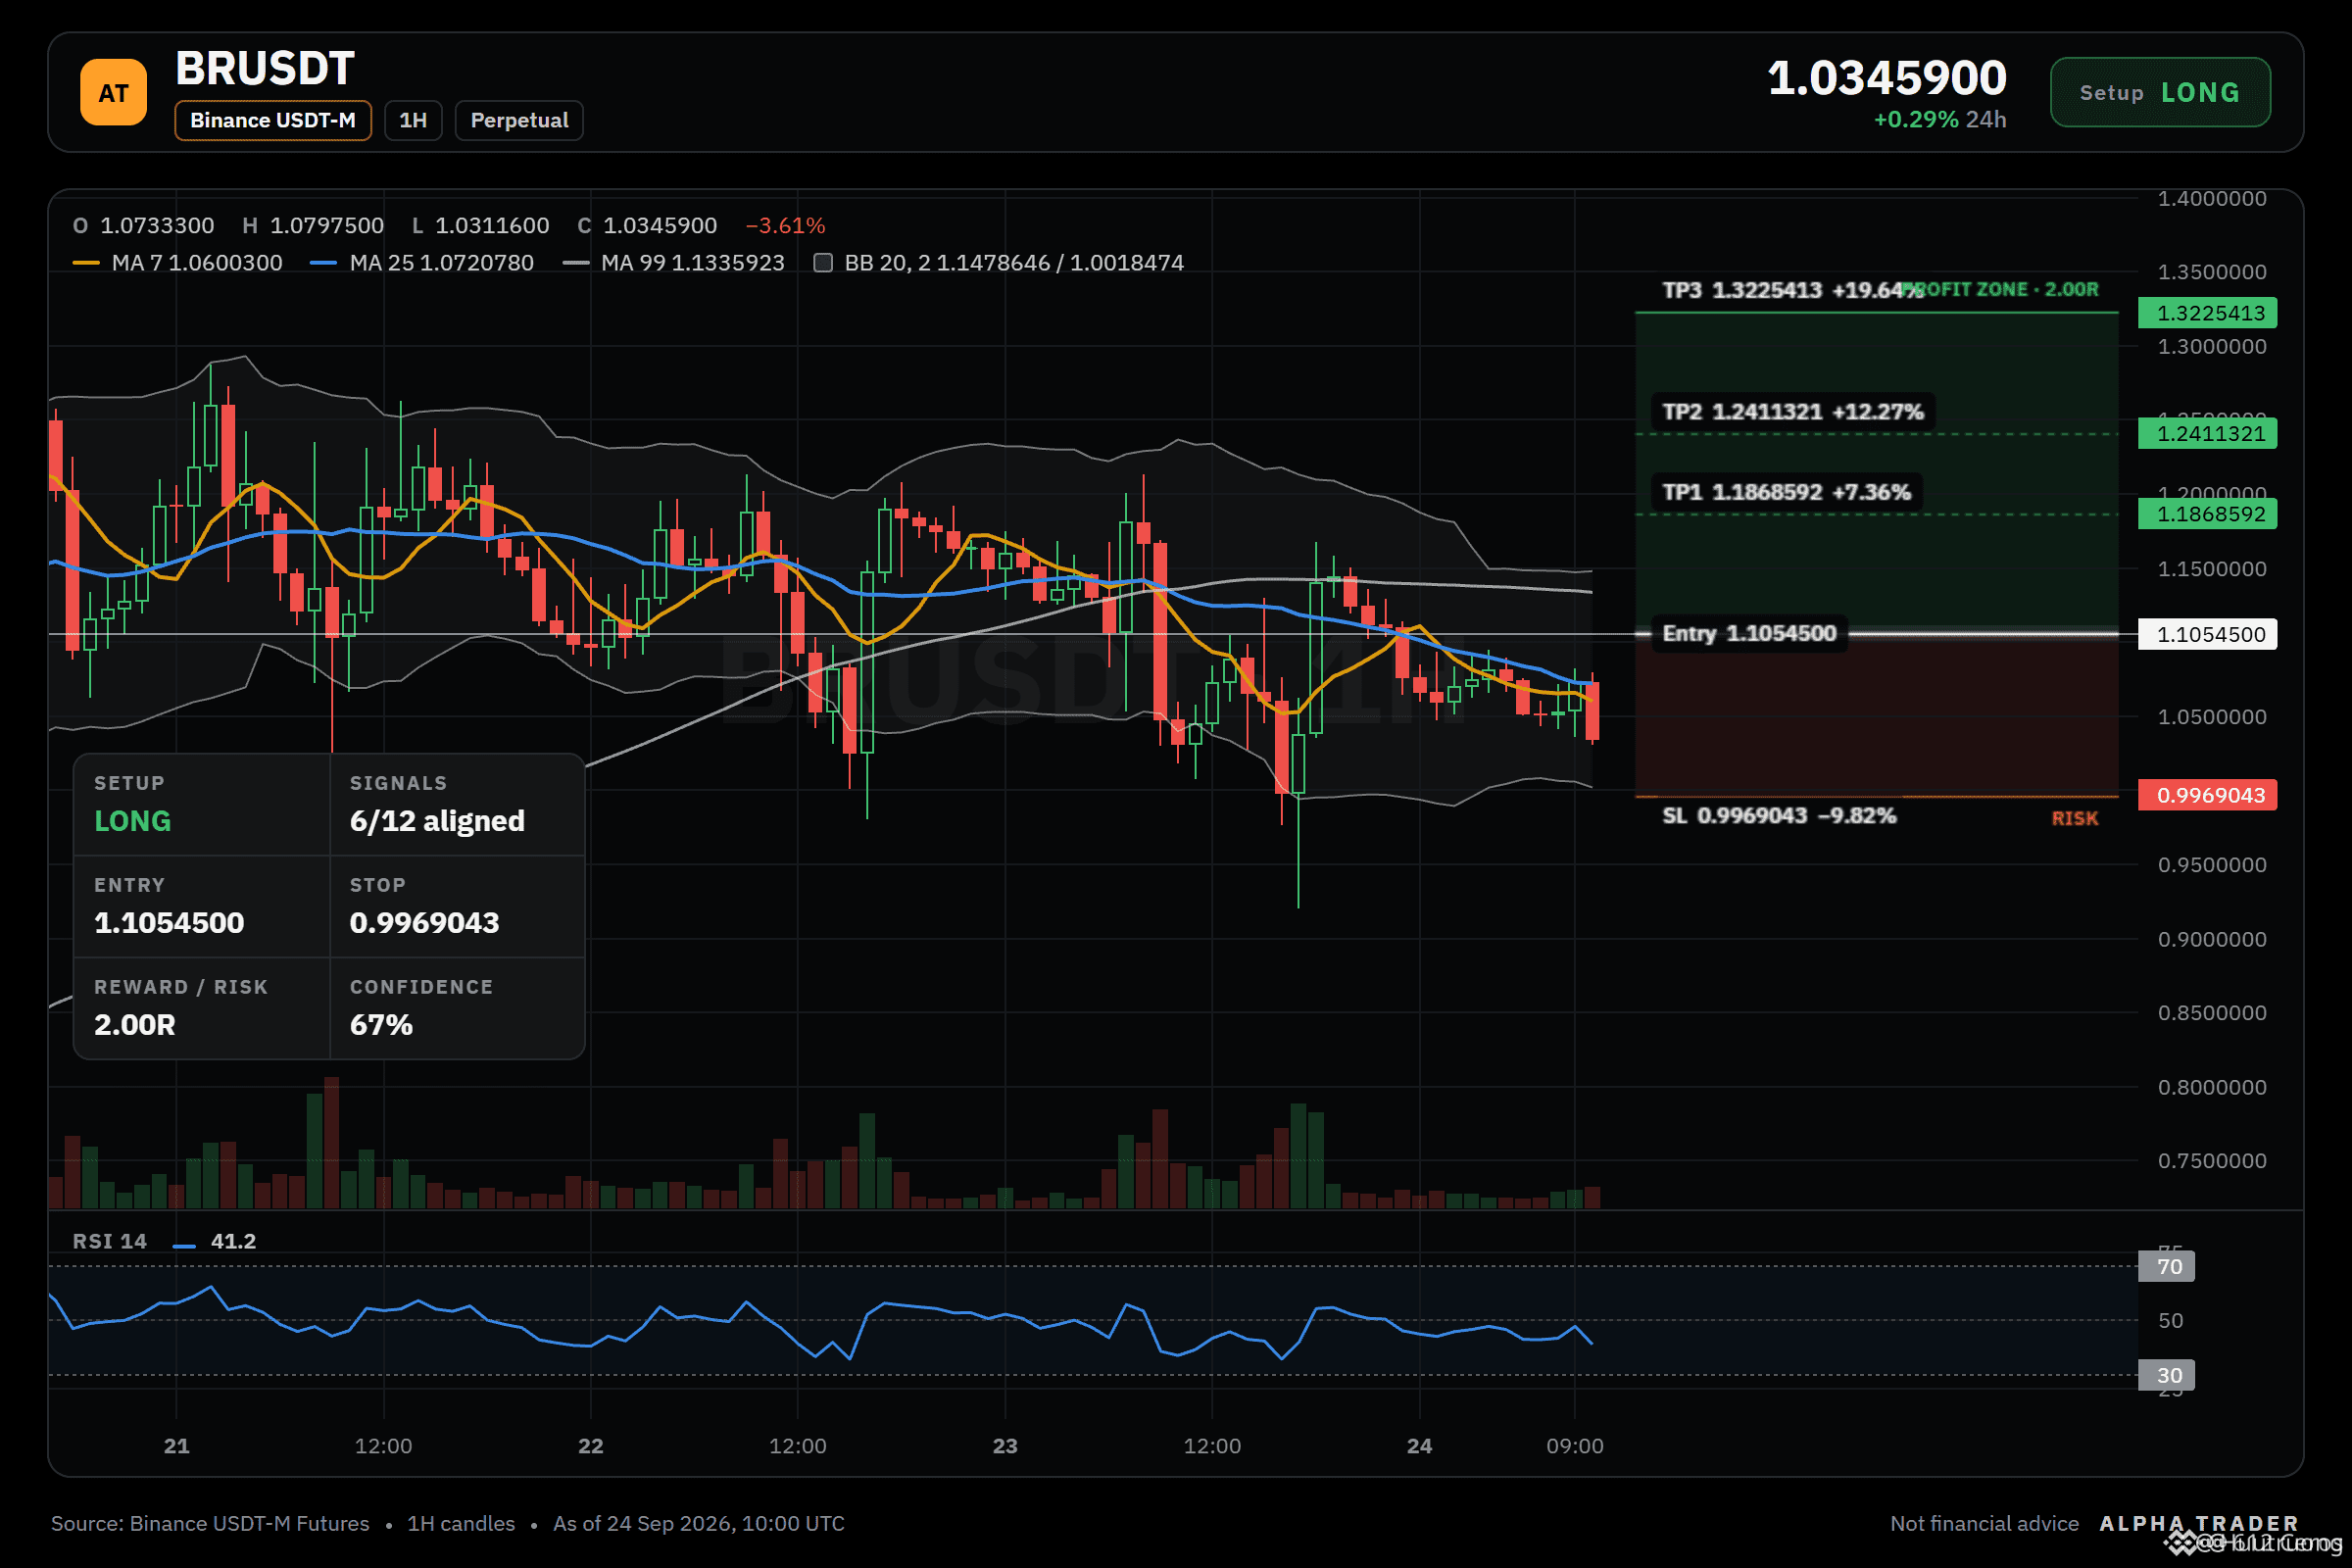
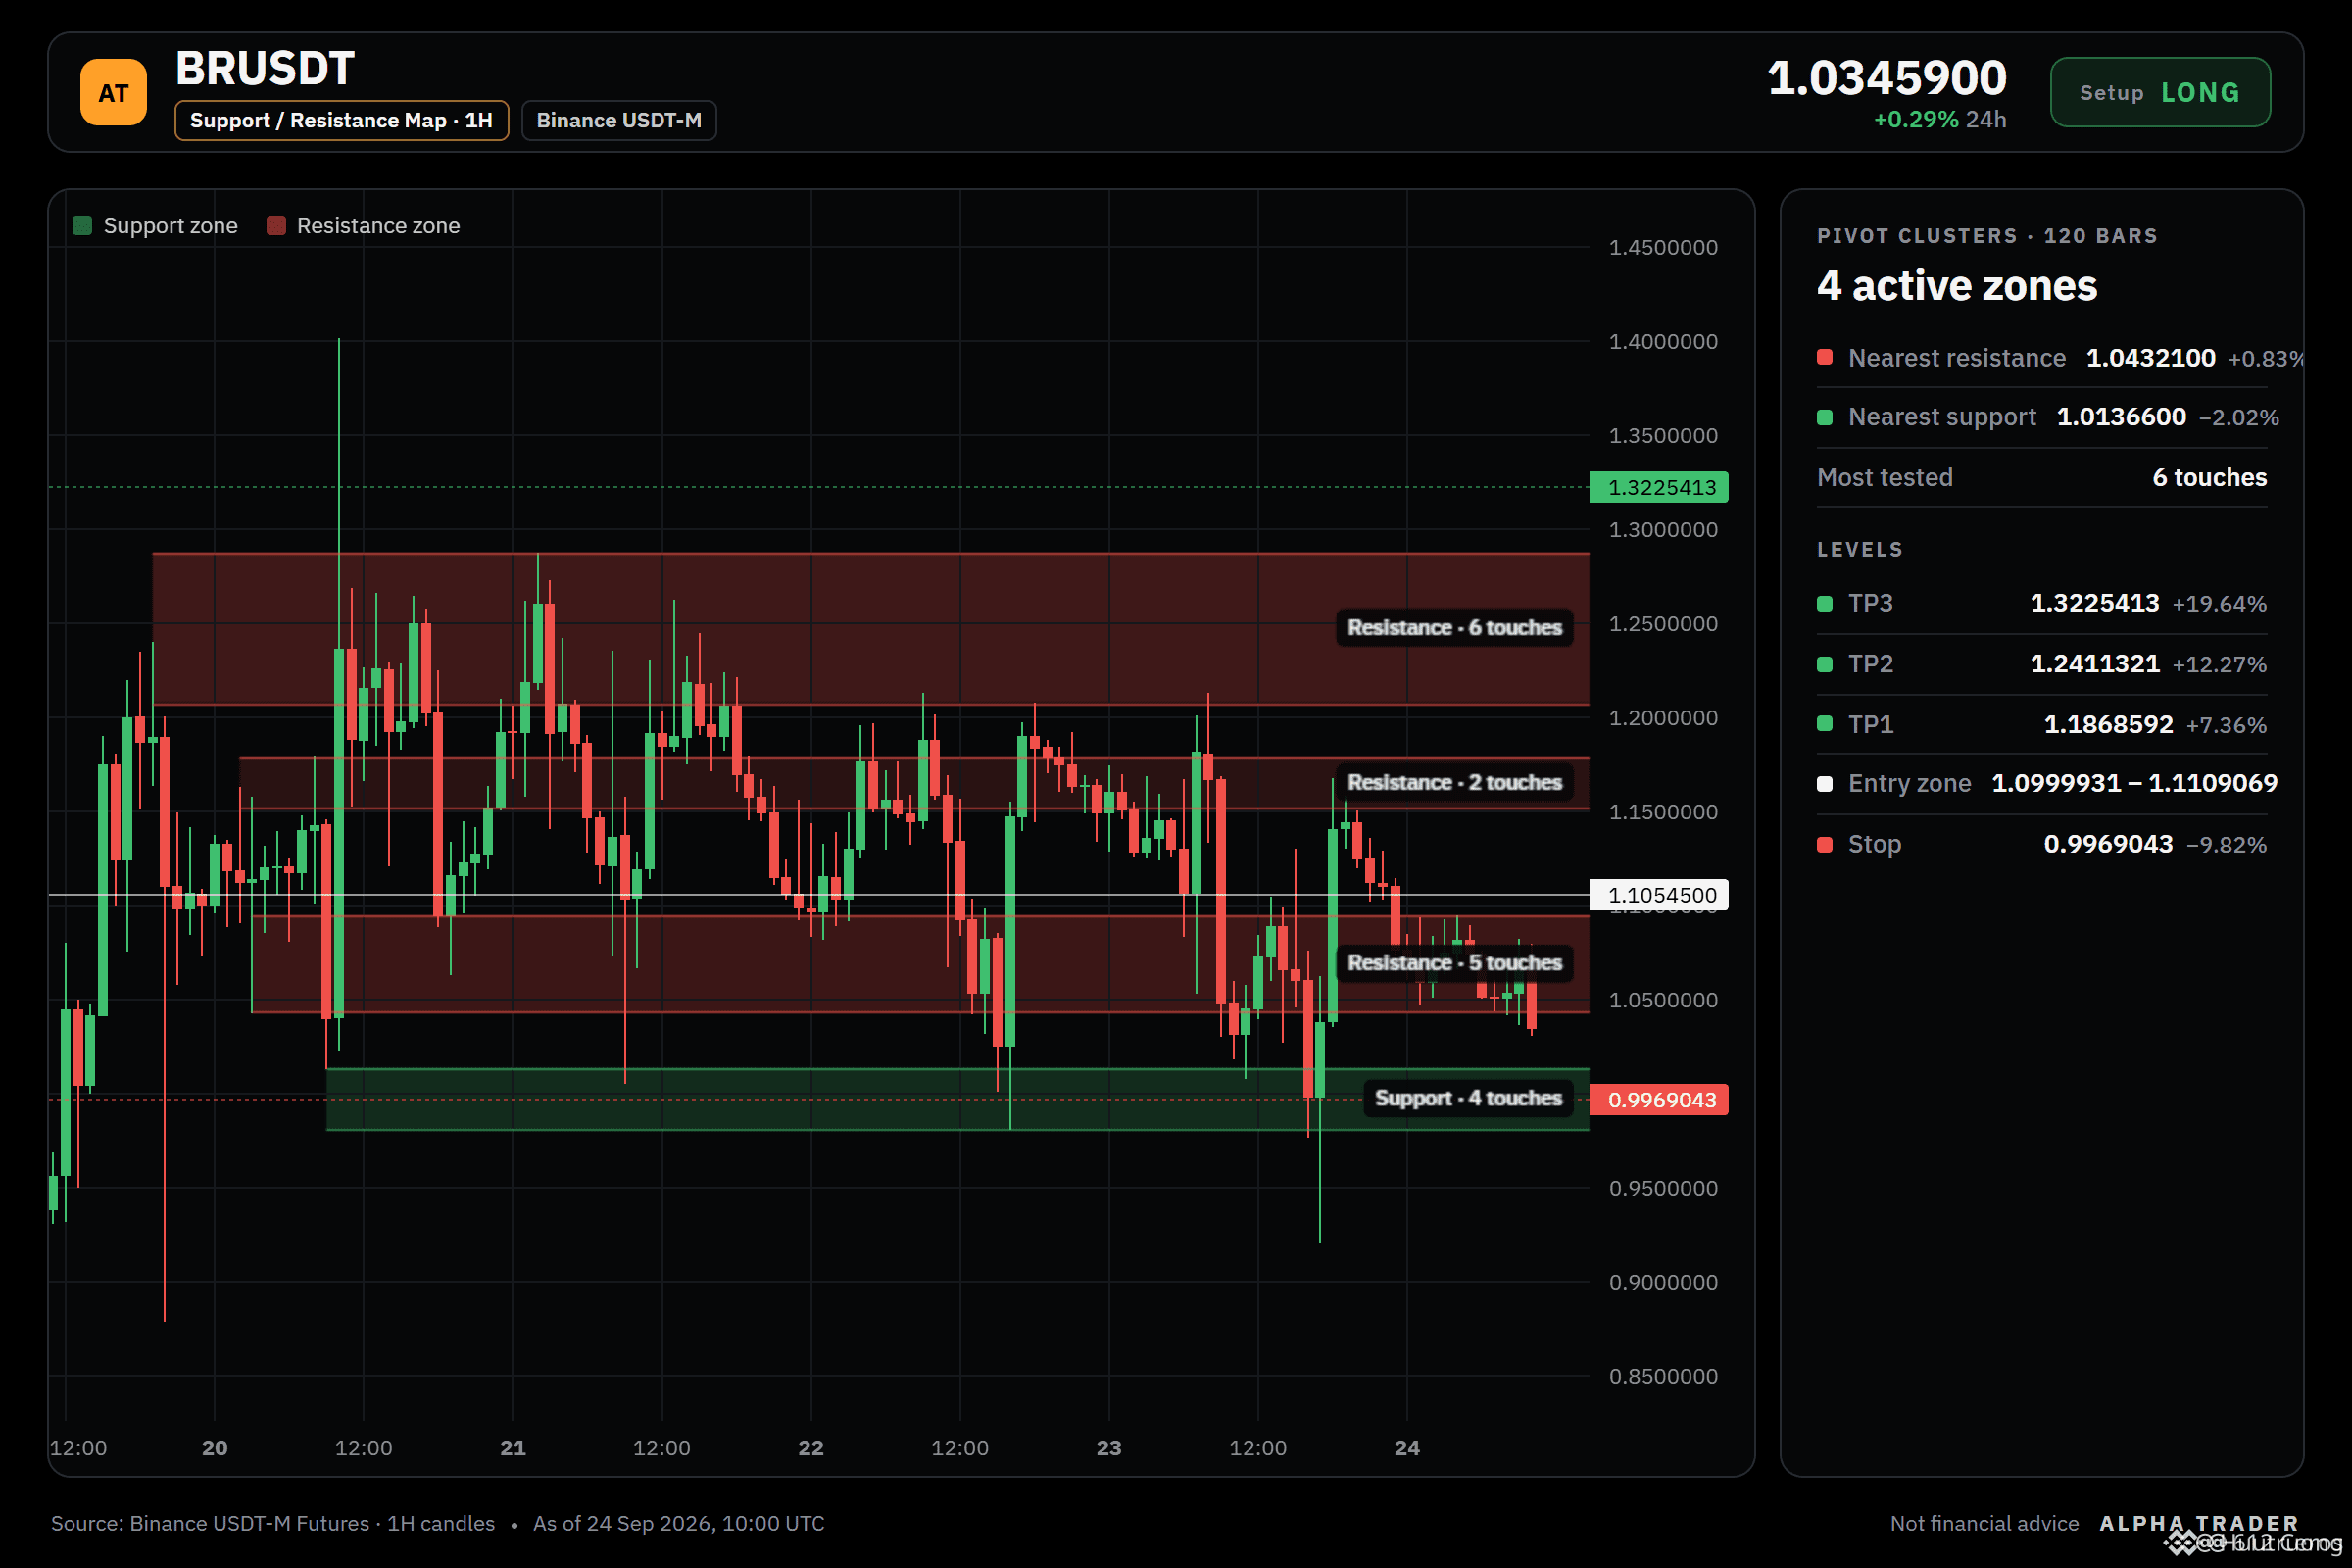
I’m watching a LONG scenario on BR with a daily stacked bullish trend and the 1h price structure stacked above its EMAs. I want to see a test of the 1.187 area as TP1, with potential expansion to 1.241 if the uptrend keeps going. The strongest supporting factors are the daily bullish stack, 4h bullish stack, and 1h bullish stack. My invalidation level is 0.8809035; if BR breaks below it, the scenario is wrong. I’ll be wrong if the risk of fading the 1h RSI at 41.2 triggers a sudden reversal toward that invalidation level. I’m sizing based on the confidence point 67.4 and respecting the ATR 0.045 on the 1h chart.
Milestones:
Entry: 1.0999931 – 1.1109069
SL: 0.9969043
TP1: 1.1868592
TP2: 1.2411321
TP3: 1.3225413
Discussion:
Where would you take profit or cut loss on BR if it gets close to 1.187?
Full scenario on the chart 👇
Journal note: BR
$BR /USDT · Ratio: LONG · 6/12 signals in agreement
Technical conclusion: STRONG LONG. 6/12 signals in agreement, 2 signals against.
Supporting factors (6):
• Daily trend: price > EMA50 > EMA200, bullish stack
• 4h trend: price > EMA50 > EMA200, bullish stack
• 1h trend: price > EMA50 > EMA200, bullish stack
• Short-term momentum (15m): RSI z-score +2.58, latest candle +3.58%, buyers are pressing
Opposing points (2):
• 1h RSI: 41.2, bearish momentum (below 45)
• Extreme RSI within a zone: RSI z-score +2.58 in the zone, risk of fade-the-high
I’m watching a LONG scenario on BR with a daily stacked bullish trend and the 1h price structure stacked above its EMAs. I want to see a test of the 1.187 area as TP1, with potential expansion to 1.241 if the uptrend keeps going. The strongest supporting factors are the daily bullish stack, 4h bullish stack, and 1h bullish stack. My invalidation level is 0.8809035; if BR breaks below it, the scenario is wrong. I’ll be wrong if the risk of fading the 1h RSI at 41.2 triggers a sudden reversal toward that invalidation level. I’m sizing based on the confidence point 67.4 and respecting the ATR 0.045 on the 1h chart.
Milestones:
Entry: 1.0999931 – 1.1109069
SL: 0.9969043
TP1: 1.1868592
TP2: 1.2411321
TP3: 1.3225413
Discussion:
Where would you take profit or cut loss on BR if it gets close to 1.187?
Full scenario on the chart 👇