


1. Weekly chart: a typical “dealer-coin roller coaster”
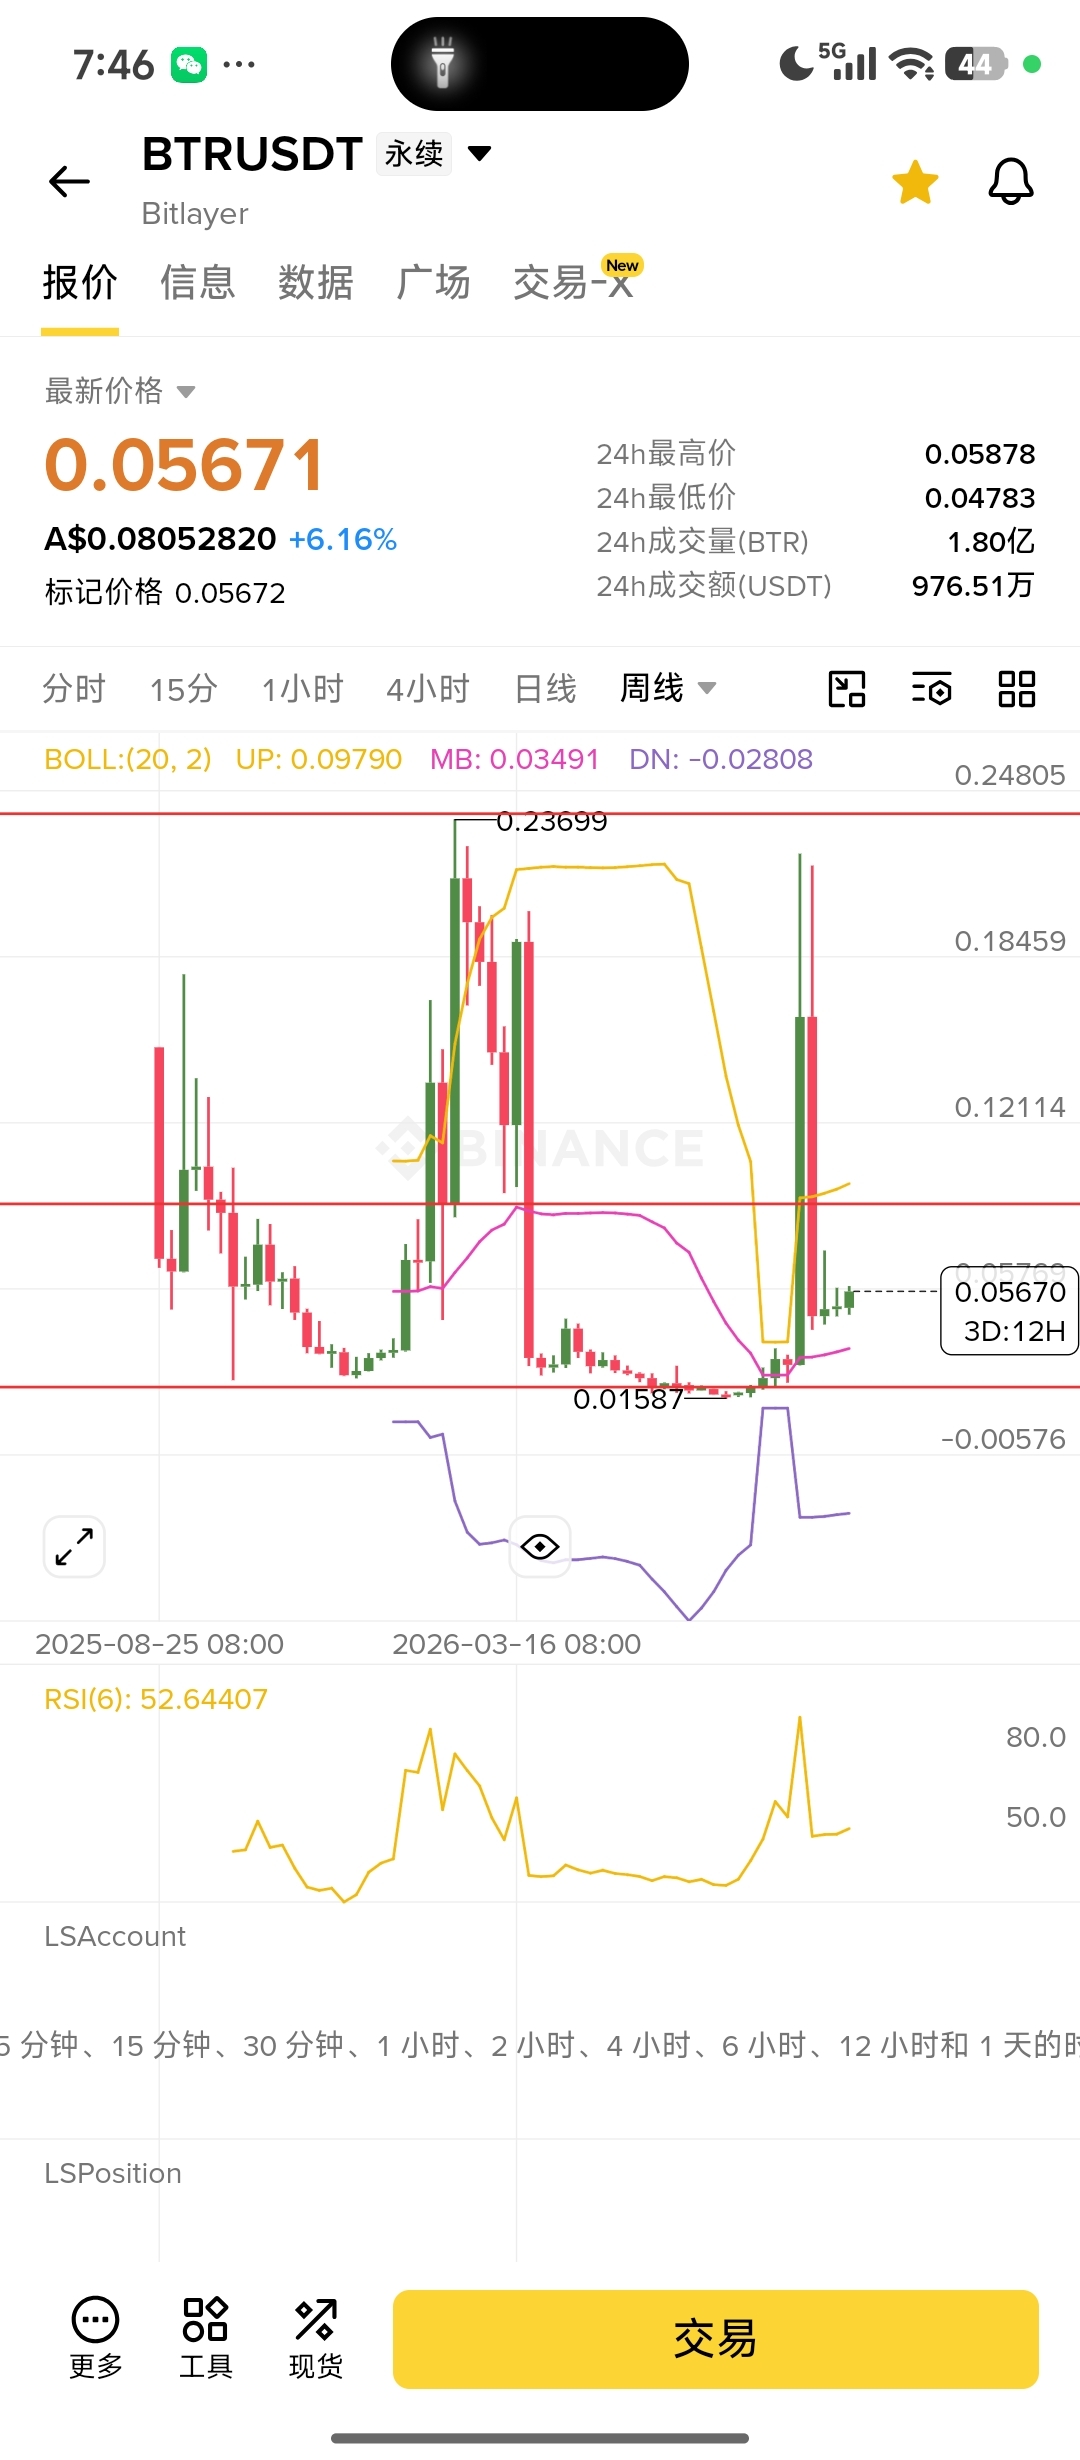
The prior high is a grave: previously, there was a violent surge from around 0.015 up to 0.23699—this is the typical pump-and-dump stage for a new coin or a dealer-controlled coin. Now it has fallen back to around 0.056, which means that most of the funds that came in from the high are already trapped.
The nature of the current rebound: this weekly candle is a big bullish one that surged directly from the bottom at 0.01587 back to 0.05671, a huge gain. But note that it has not broken through the prior high’s resistance level; in fact, it’s still some distance away from the weekly Bollinger Band’s midline (MB: 0.03491). In dealer coins, this kind of violent rebound after a deep drop often isn’t meant to kick off a second main advance; it’s for “self-rescue”—to create an illusion for people who are trapped, lure retail investors into buying the dip, and allow the main players to distribute at a higher level.
2. Liquidation heat map: the top is the “bait,” and the bottom is the “trap.”
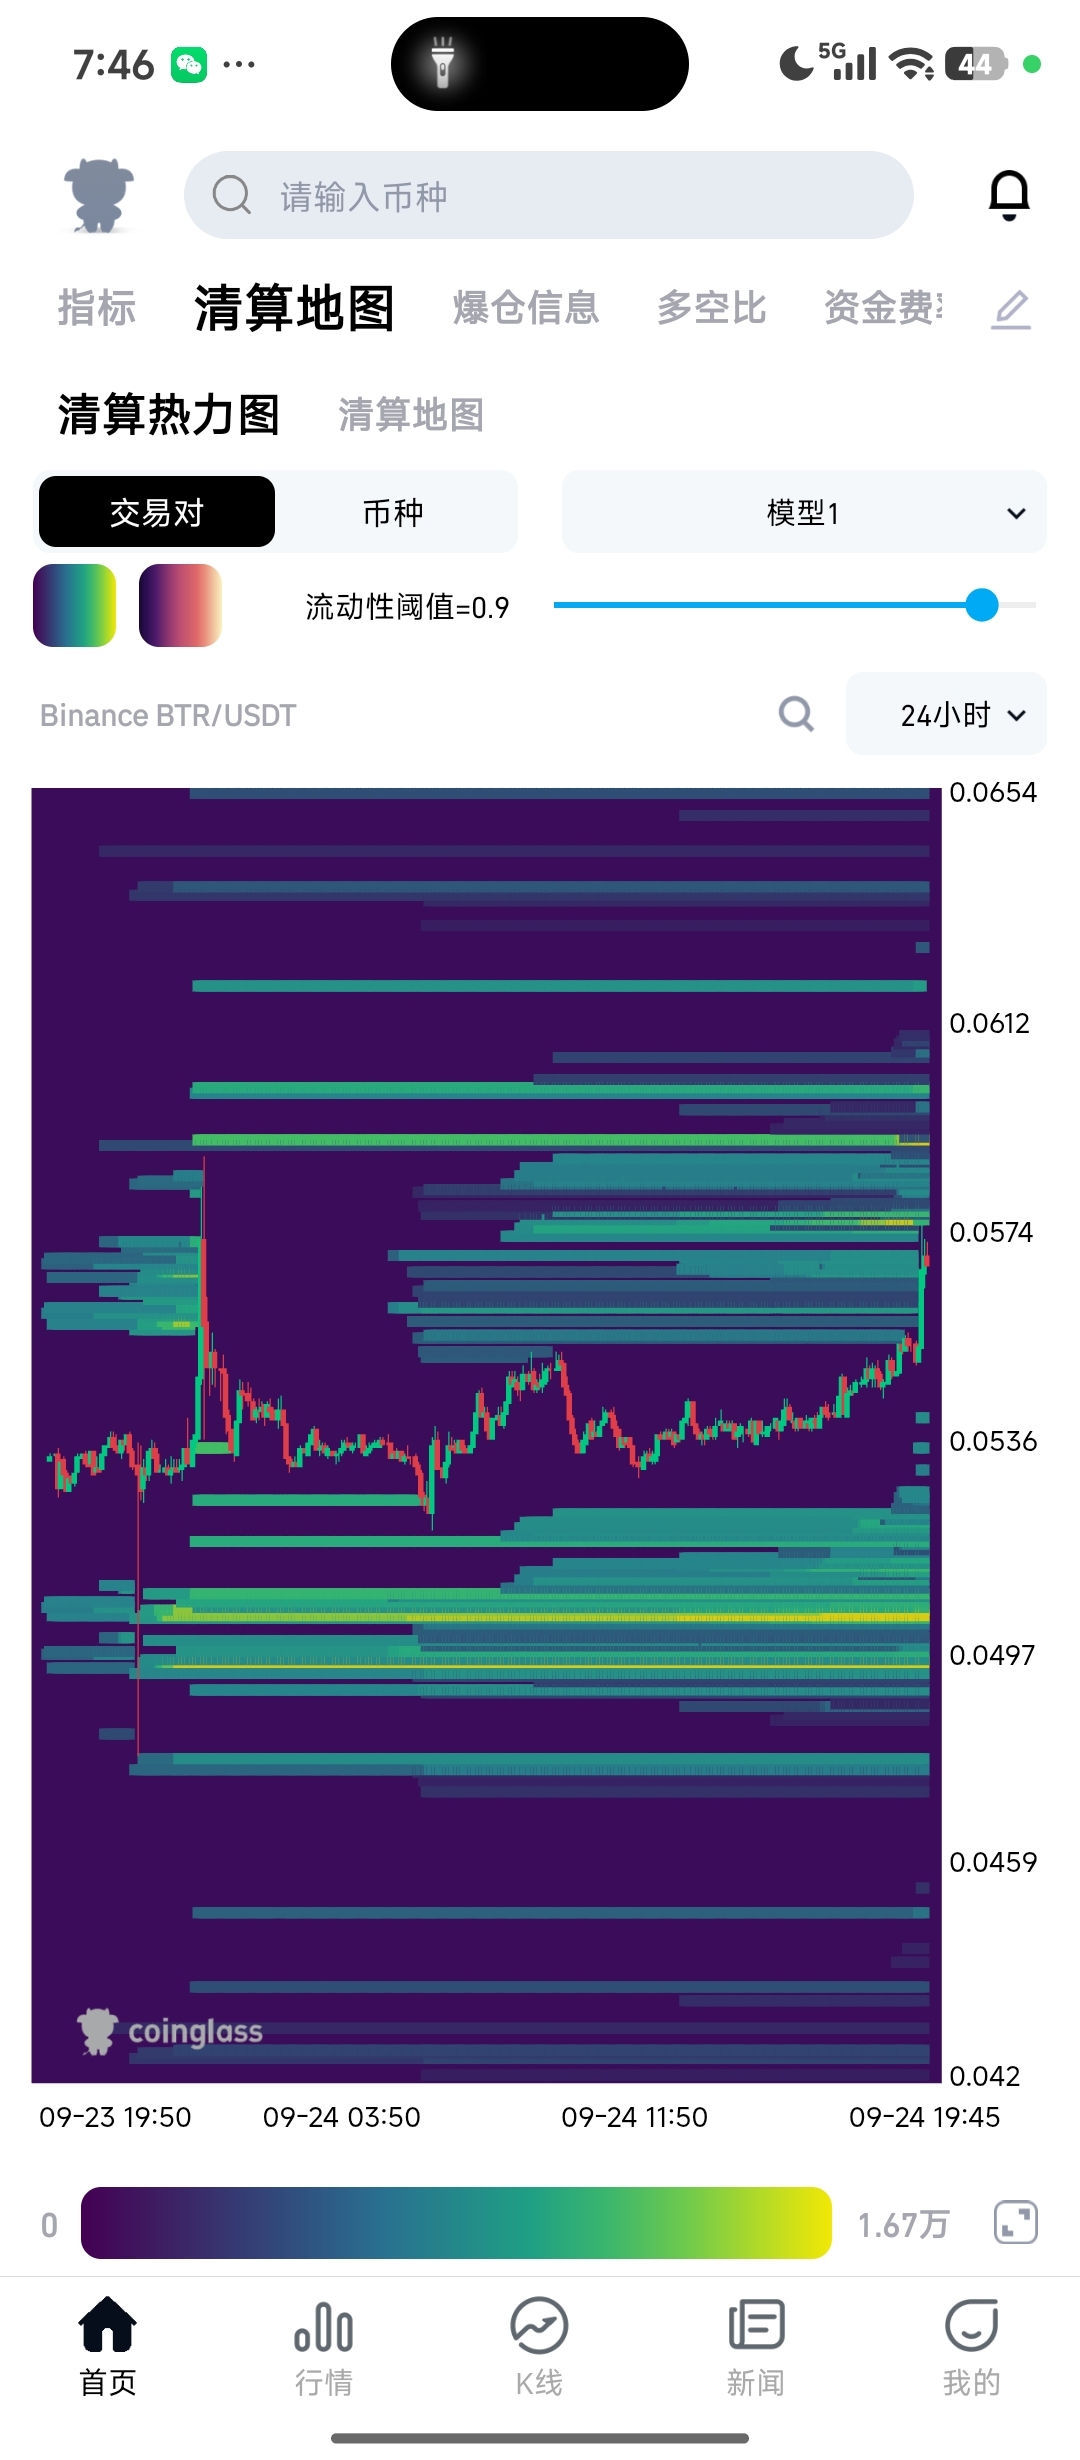
Look at the second chart, and combine it with the first chart: the current price is 0.05671:
Dense band around 0.0574: this is where a large number of liquidation orders are stacked (the green horizontal lines are densely packed). This means that if the main force nudges the price a bit higher—pushing it into the 0.0575–0.058 area—it will trigger a wave of short liquidations (long kills short).
The dense band below 0.0497: this is the stop-loss zone set by dip-buying funds.
Main force playbook simulation: The current surge is likely to test the resistance around 0.0574. If the test succeeds and triggers a short squeeze/forced buy liquidation with abundant liquidity, then that would be the best timing for the main force to unload aggressively. Once the unloading is finished, the price will very likely drop quickly—testing and possibly breaking below 0.0497—wiping out the longs who rush in to buy the dip right now.
💡 Current response strategy: don’t take “bloody chips.”
Right now at this level (0.05671) is very awkward—it’s the “end of the rebound” and also the “starting point for distribution.”
Never chase longs: This coin has rebounded from 0.015 to 0.056—it's already up more than three times. Going long now is like lifting the main force’s sedan; the chances of becoming the bag-holding latecomers are extremely high.
If you want to short (trade with the opposite view): closely monitor how the price behaves near 0.0574–0.0588 (24h high). If the price pushes up to this area and fails to gain momentum, and you see clear long upper wicks or a volume-backed stall, then that’s an excellent entry point for a short at a high level. Put the stop-loss just above 0.06.
If you want to go long (bet against the trend): the risk is extremely high. Unless the weekly chart can break out on strong volume and hold above 0.06, any rebound is an opportunity to escape.
In one sentence: BTR is now “a dead cat bounce on the weekly chart, with the main force using the rebound to lure and unload.” Around 0.0574 is the main force’s “slaughterhouse.” $BTR $BROCCOLI714