BTC IS PULLING BACK FROM 87K — THE 74K AREA REMAINS THE KEY DEEPER LEVEL
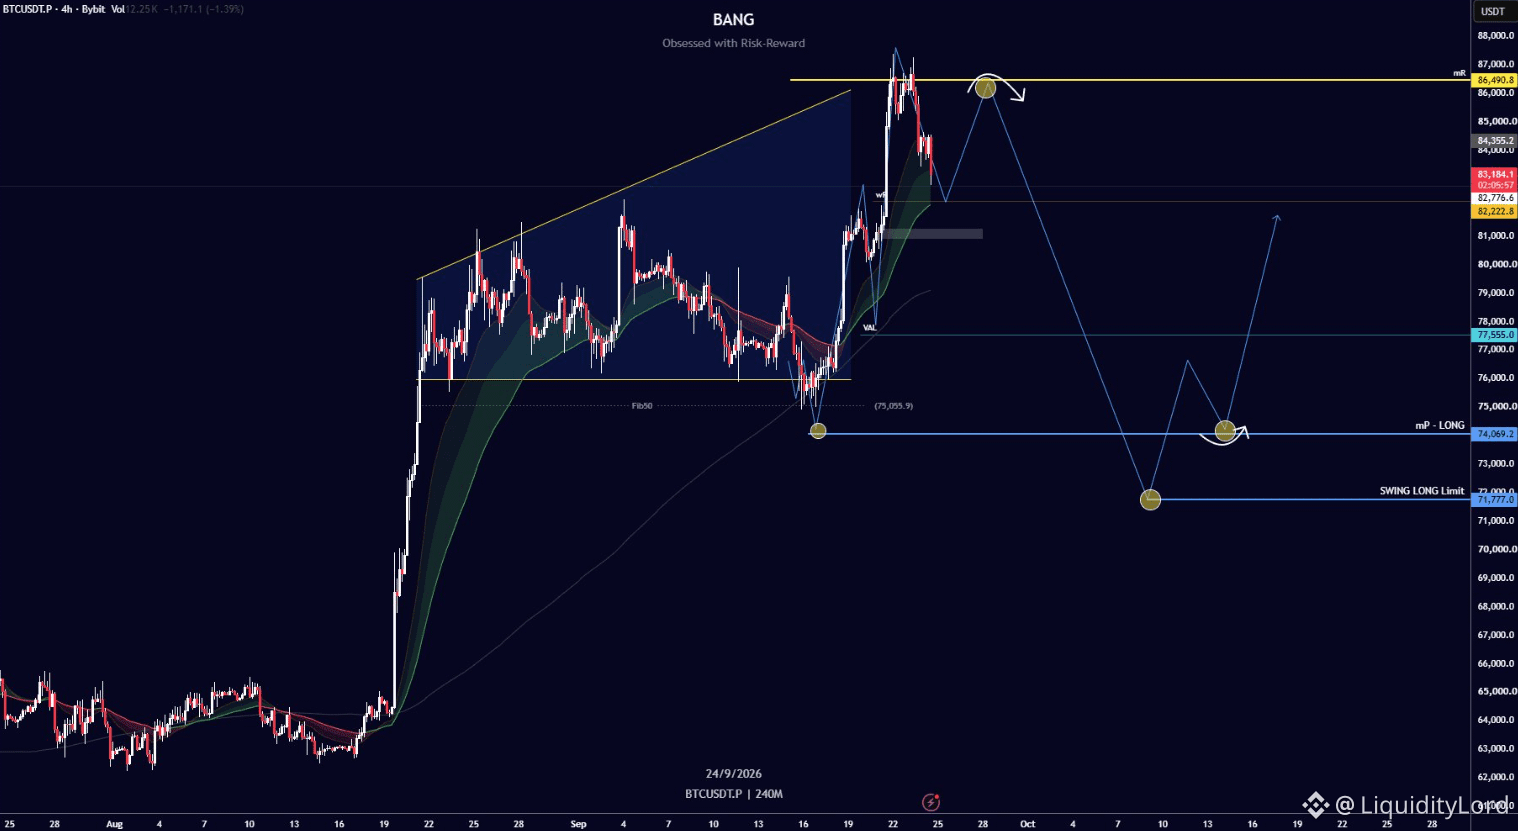
BTC/USDT on the 4H chart is around 83.2K after a sharp advance from the 62–65K area. Price pushed through the previous range, reached the 86.5–87K region, and is now retracing. The chart is showing a large expansion followed by a corrective phase rather than a clean continuation.
🧭 THE STRUCTURE AFTER THE BREAKOUT
The strongest part of the move came from the reclaim of the 77.5K area. BTC then accelerated through 82K and reached the upper resistance near 86.5K. The current pullback is testing whether that expansion can turn into a broader higher-low structure. A successful hold would keep the recovery sequence intact, while rejection from resistance would favor another test of support and liquidity below before another expansion phase.
The marked path leaves room for another reaction before a deeper retracement. 82.2K is important, while the lower levels remain downside references.
🎯 TRADE PARAMETERS
Entry: 82.2K–83.2K
Invalidation: 71.7K
TP1: 86.5K
TP2: 74.1K
TP3: 71.7K
These are chart references, not guarantees. BTC is between resistance and deeper support, so confirmation matters more than chasing volatility.
📊 THE RANGE IS WIDENING
BTC moved rapidly through several acceptance areas. 86.5K is the visible ceiling, while 77.5K remains an important structural reference. Losing the upper support area leaves room toward 74K and potentially 71.7K.
⚙ A DIFFERENT EXECUTION ANGLE
ST0Nfi approaches DeFi execution from the liquidity side, helping users understand how swaps interact with available liquidity and why final execution can differ from the first displayed quote. It is separate from the BTC setup and does not confirm this chart.
For now, BTC is at a key decision area. The reaction around these levels will show whether this is a retracement or a deeper rotation.
NFA - DYOR
$BTC
BTC/USDT on the 4H chart is around 83.2K after a sharp advance from the 62–65K area. Price pushed through the previous range, reached the 86.5–87K region, and is now retracing. The chart is showing a large expansion followed by a corrective phase rather than a clean continuation.
🧭 THE STRUCTURE AFTER THE BREAKOUT
The strongest part of the move came from the reclaim of the 77.5K area. BTC then accelerated through 82K and reached the upper resistance near 86.5K. The current pullback is testing whether that expansion can turn into a broader higher-low structure. A successful hold would keep the recovery sequence intact, while rejection from resistance would favor another test of support and liquidity below before another expansion phase.
The marked path leaves room for another reaction before a deeper retracement. 82.2K is important, while the lower levels remain downside references.
🎯 TRADE PARAMETERS
Entry: 82.2K–83.2K
Invalidation: 71.7K
TP1: 86.5K
TP2: 74.1K
TP3: 71.7K
These are chart references, not guarantees. BTC is between resistance and deeper support, so confirmation matters more than chasing volatility.
📊 THE RANGE IS WIDENING
BTC moved rapidly through several acceptance areas. 86.5K is the visible ceiling, while 77.5K remains an important structural reference. Losing the upper support area leaves room toward 74K and potentially 71.7K.
⚙ A DIFFERENT EXECUTION ANGLE
ST0Nfi approaches DeFi execution from the liquidity side, helping users understand how swaps interact with available liquidity and why final execution can differ from the first displayed quote. It is separate from the BTC setup and does not confirm this chart.
For now, BTC is at a key decision area. The reaction around these levels will show whether this is a retracement or a deeper rotation.
NFA - DYOR
$BTC