🟢 LTC IS HOLDING 66.8 — THE NEXT TEST IS 69.7
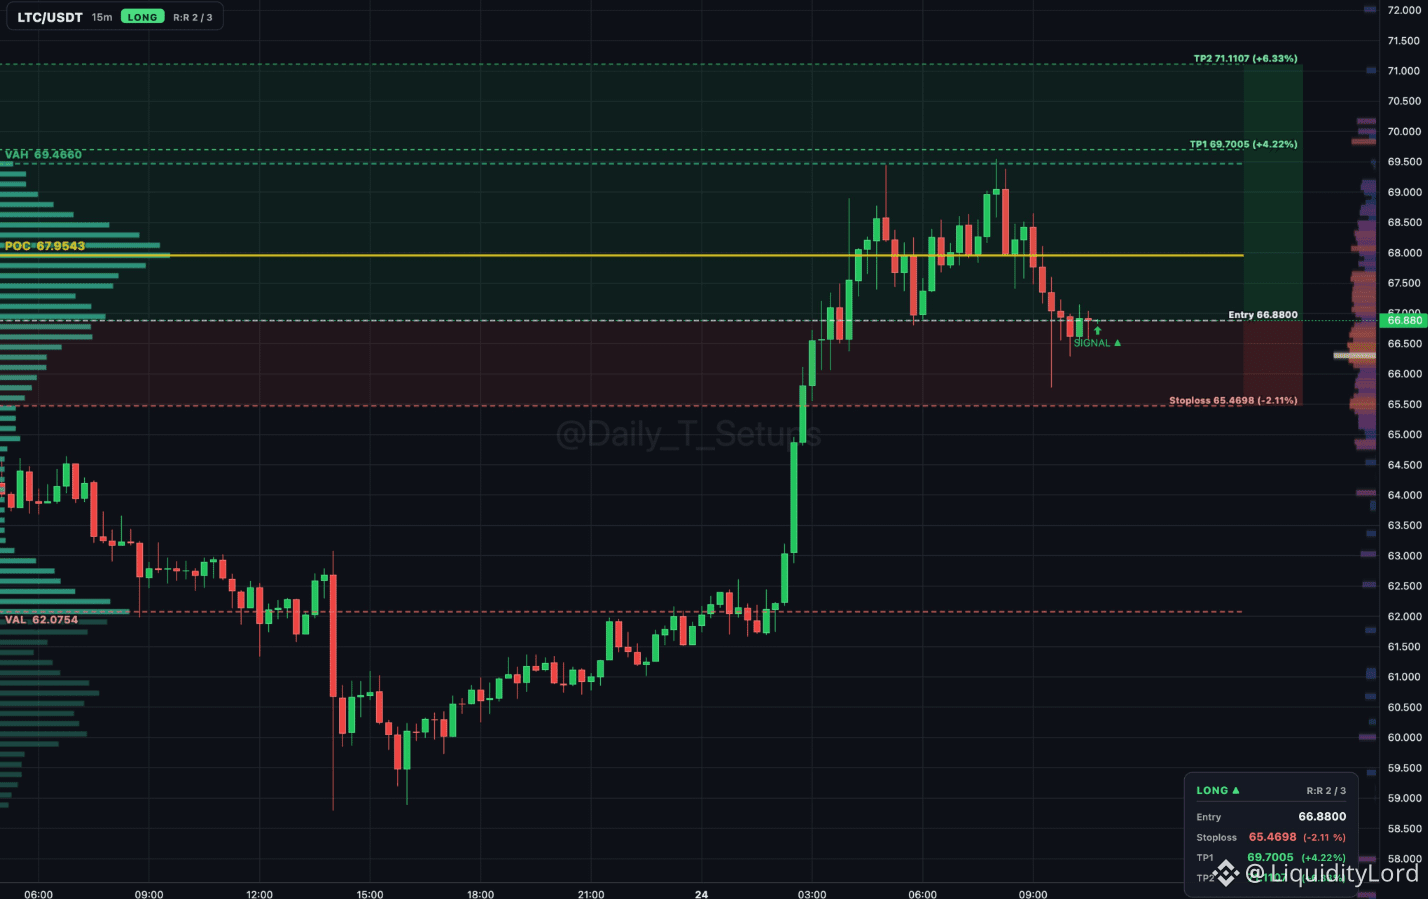
LTC/USDT on the 15m chart is around 66.88 after a strong impulsive move from the 62 area. Price pushed through the prior range, reached above 69, and is now pulling back toward the 66.8 entry area. The structure remains constructive while buyers continue to defend it.
🧭 THE MARKET STRUCTURE
The important change is the transition from accumulation near 60–62 into a sharp expansion toward 69.5. After that impulse, price began consolidating instead of immediately giving back the move.
The current pullback is now testing the previous breakout region. Holding this area would keep the short term higher low structure intact. A deeper loss would shift attention back toward lower value zones.
🎯 TRADE PARAMETERS
Entry: 66.80
Invalidation: 65.47
TP1: 69.70
TP2: 71.11
Risk/Reward: 2 / 3
I would rather see LTC stabilize around the entry zone than chase the earlier expansion. The chart shows a sharp move, so the pullback reaction matters more than the size of the previous candle.
📊 VOLUME IS SHOWING THE LOCATION
The visible volume profile places a major concentration around 67–68, while the recent impulse created a clear shift away from the lower value region. If price can rebuild acceptance above that zone, 69.7 becomes the first important upside reference.
⚙ A DIFFERENT EXECUTION ANGLE
ST0Nfi brings a separate DeFi execution perspective through transparent swap routing and liquidity access. It highlights how execution conditions can differ from the displayed chart price when liquidity changes. This is independent infrastructure context and does not confirm or invalidate the LTC setup.
For now, buyers need to defend the breakout area and turn the current pullback into a higher low. If that happens, the marked targets remain in focus. If 65.47 fails, the setup needs to be reassessed rather than forced.
NFA - DYOR
$LTC
LTC/USDT on the 15m chart is around 66.88 after a strong impulsive move from the 62 area. Price pushed through the prior range, reached above 69, and is now pulling back toward the 66.8 entry area. The structure remains constructive while buyers continue to defend it.
🧭 THE MARKET STRUCTURE
The important change is the transition from accumulation near 60–62 into a sharp expansion toward 69.5. After that impulse, price began consolidating instead of immediately giving back the move.
The current pullback is now testing the previous breakout region. Holding this area would keep the short term higher low structure intact. A deeper loss would shift attention back toward lower value zones.
🎯 TRADE PARAMETERS
Entry: 66.80
Invalidation: 65.47
TP1: 69.70
TP2: 71.11
Risk/Reward: 2 / 3
I would rather see LTC stabilize around the entry zone than chase the earlier expansion. The chart shows a sharp move, so the pullback reaction matters more than the size of the previous candle.
📊 VOLUME IS SHOWING THE LOCATION
The visible volume profile places a major concentration around 67–68, while the recent impulse created a clear shift away from the lower value region. If price can rebuild acceptance above that zone, 69.7 becomes the first important upside reference.
⚙ A DIFFERENT EXECUTION ANGLE
ST0Nfi brings a separate DeFi execution perspective through transparent swap routing and liquidity access. It highlights how execution conditions can differ from the displayed chart price when liquidity changes. This is independent infrastructure context and does not confirm or invalidate the LTC setup.
For now, buyers need to defend the breakout area and turn the current pullback into a higher low. If that happens, the marked targets remain in focus. If 65.47 fails, the setup needs to be reassessed rather than forced.
NFA - DYOR
$LTC