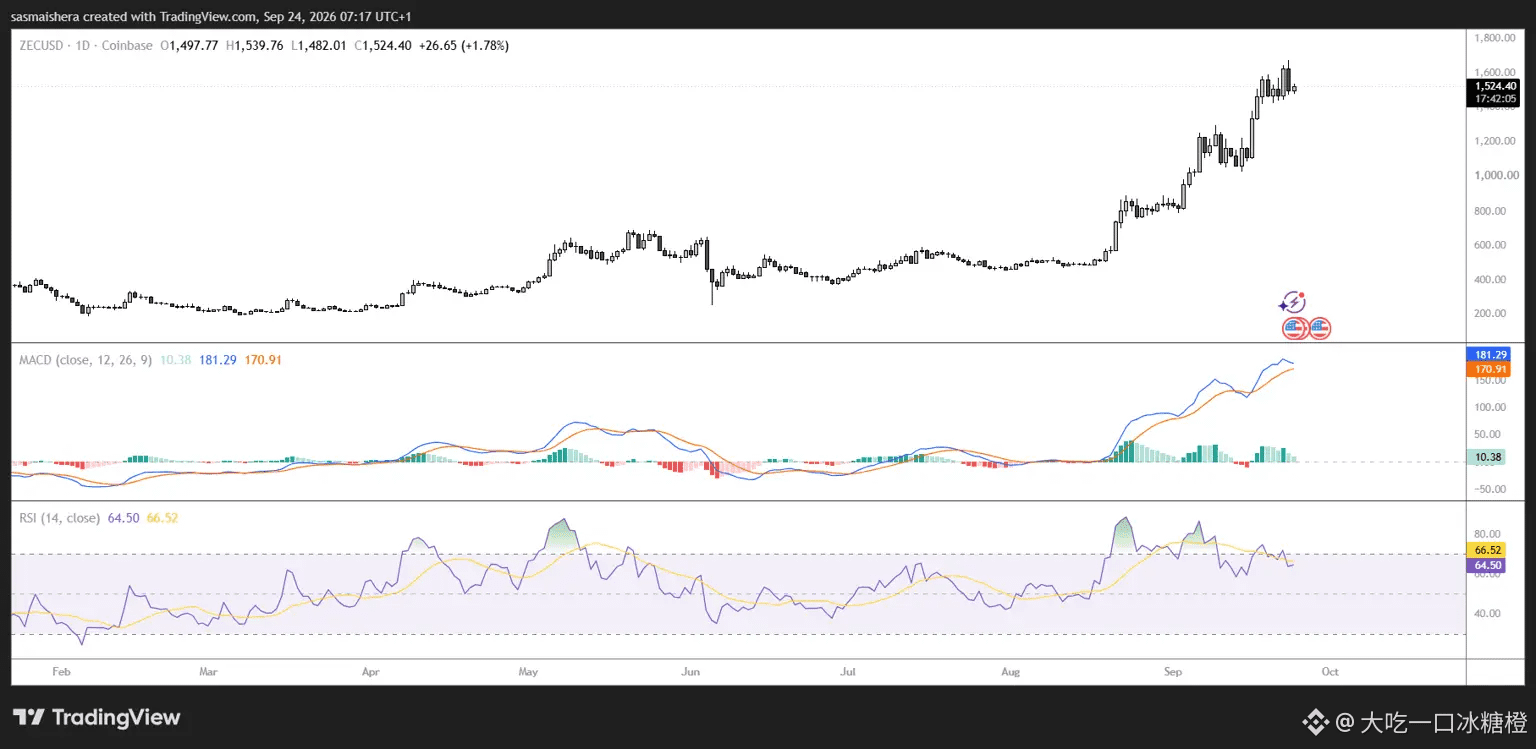
#zec A pullback pressure emerged at the higher level.
ZEC once surged to around $1,700, nearly doubling, but then fell below $1,500. Data shows there is significant long liquidation pressure below $1,488.
Technical indicators show a daily top divergence; the $1,700–$1,750 zone is key resistance in the short term.
On the downside, watch the $1,488 support level, with further focus on the $1,296–$1,220 range. The trend has not broken, but the risk from high leverage at higher levels is increasing.
ZEC once surged to around $1,700, nearly doubling, but then fell below $1,500. Data shows there is significant long liquidation pressure below $1,488.
Technical indicators show a daily top divergence; the $1,700–$1,750 zone is key resistance in the short term.
On the downside, watch the $1,488 support level, with further focus on the $1,296–$1,220 range. The trend has not broken, but the risk from high leverage at higher levels is increasing.