⚡ $RAY is rising by +17.1\% and testing resistance! Will we see a breakout toward 2.50?
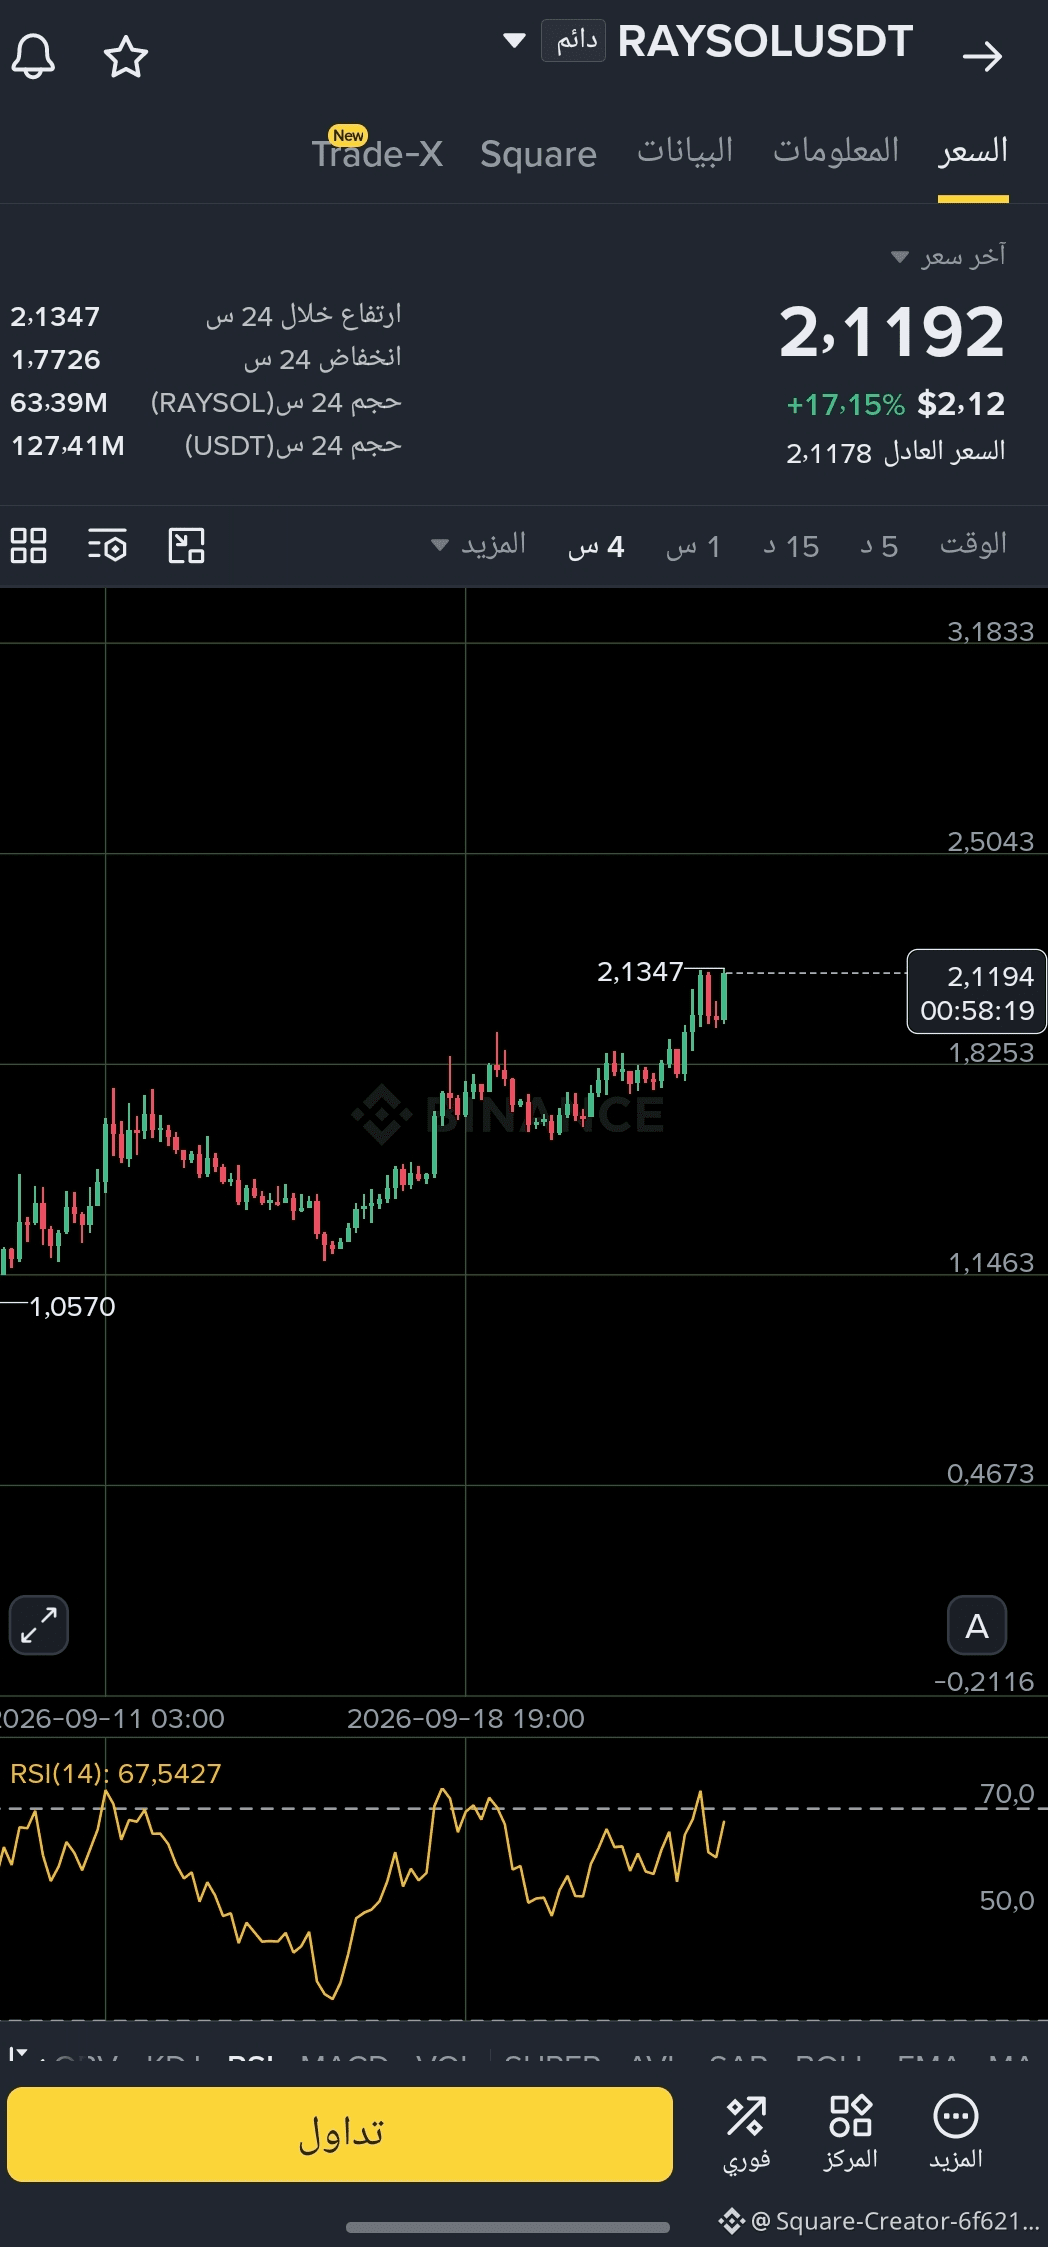
The $RAY coin continues its strong upward trend on the 4-hour chart, where it is currently trading at 2.1192, touching the most recent high of 2.1347 amid high liquidity.
📊 Numbers and Technical Indicators:
* RSI(14) indicator: It stands at 67.54, an excellent level that reflects strong buying momentum (Bullish Momentum) and gives the price room to continue rising before reaching areas of sharp overbought above 70.
* Trading Volume: It exceeded 127.41 million USDT in 24 hours, showing increasing trader interest.
* Upcoming Levels: A breakout above 2.1350 and a close higher than it paves the way to target the 2.5040 area.
🎯 Expected Trading Scenarios:
* Breakout & Continued Upside (LONG):
* Entry condition: Wait for a 4-hour candle to close firmly above 2.1350, or catch the price during any retest of the 1.8250 support.
* Targets: 2.3000 🎯 - 2.5040 🎯
* Stop Loss: Close below 1.8000.
* Short / Scalp Pullback Scenario:
* If the price rejects the current top and a reversal candle appears, we may see a retest of nearby support zones around 1.8250.
⚠️ Risk Management:
* Leverage: It is recommended not to exceed 3x to 5x to reduce risk given the volatility of Futures contracts.
* Always set a Stop Loss to protect capital.
What is your expectation for the next move of $RAY ?
The $RAY coin continues its strong upward trend on the 4-hour chart, where it is currently trading at 2.1192, touching the most recent high of 2.1347 amid high liquidity.
📊 Numbers and Technical Indicators:
* RSI(14) indicator: It stands at 67.54, an excellent level that reflects strong buying momentum (Bullish Momentum) and gives the price room to continue rising before reaching areas of sharp overbought above 70.
* Trading Volume: It exceeded 127.41 million USDT in 24 hours, showing increasing trader interest.
* Upcoming Levels: A breakout above 2.1350 and a close higher than it paves the way to target the 2.5040 area.
🎯 Expected Trading Scenarios:
* Breakout & Continued Upside (LONG):
* Entry condition: Wait for a 4-hour candle to close firmly above 2.1350, or catch the price during any retest of the 1.8250 support.
* Targets: 2.3000 🎯 - 2.5040 🎯
* Stop Loss: Close below 1.8000.
* Short / Scalp Pullback Scenario:
* If the price rejects the current top and a reversal candle appears, we may see a retest of nearby support zones around 1.8250.
⚠️ Risk Management:
* Leverage: It is recommended not to exceed 3x to 5x to reduce risk given the volatility of Futures contracts.
* Always set a Stop Loss to protect capital.
What is your expectation for the next move of $RAY ?