SOL: Morning observations
24.09.2026 09:00
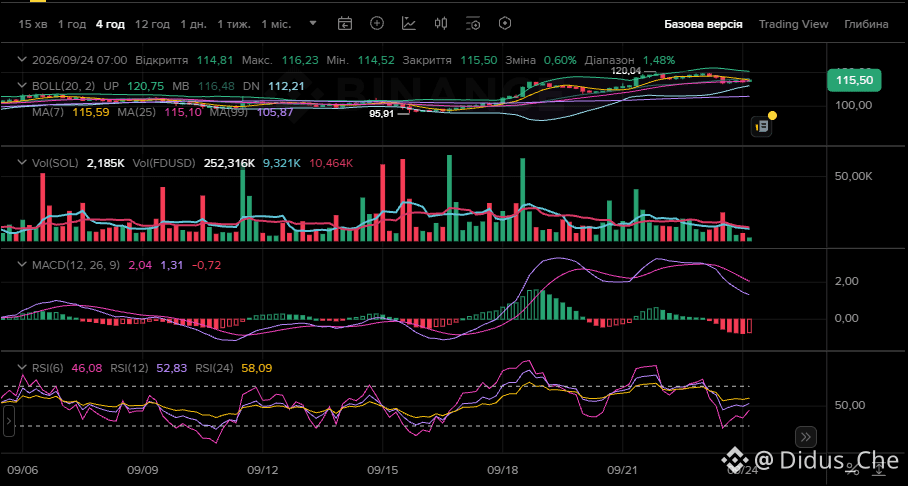
The previous baseline forecast worked out almost exactly. The price rose from 114.62 to 115.45–115.50, and the local high was 116.23. There was an expectation of stabilization within 113.50–116.00 and a technical bounce to 115.50–116.00.
And that’s exactly what happened.
Forecast for the next 12 hours
Base scenario — 55%: SOL will remain in the 114.50–116.50 range. The most likely picture is a sideways move with repeated attempts to break through 116–116.3.
Positive — 20%: a sustained hourly close above 116.30–116.50 would open up the possibility of testing 117.40, and then 118.5. For this, a noticeable increase in volume is required.
Negative — 25%: a return below 114.50 will increase the risk of another retest of 113.70–113.10. A breakdown below 113.10 will bring the lower 4H Bollinger band near 112.20 into focus.
SOL has stabilized and has recouped part of the decline, but for now this is a technical bounce rather than a confirmed reversal.
The main indicator for the next move is a breakout from the 114.50–116.50 corridor.
This is a subjective interpretation of charts and is not investment advice regarding buying or selling.
$SOL
24.09.2026 09:00
The previous baseline forecast worked out almost exactly. The price rose from 114.62 to 115.45–115.50, and the local high was 116.23. There was an expectation of stabilization within 113.50–116.00 and a technical bounce to 115.50–116.00.
And that’s exactly what happened.
Forecast for the next 12 hours
Base scenario — 55%: SOL will remain in the 114.50–116.50 range. The most likely picture is a sideways move with repeated attempts to break through 116–116.3.
Positive — 20%: a sustained hourly close above 116.30–116.50 would open up the possibility of testing 117.40, and then 118.5. For this, a noticeable increase in volume is required.
Negative — 25%: a return below 114.50 will increase the risk of another retest of 113.70–113.10. A breakdown below 113.10 will bring the lower 4H Bollinger band near 112.20 into focus.
SOL has stabilized and has recouped part of the decline, but for now this is a technical bounce rather than a confirmed reversal.
The main indicator for the next move is a breakout from the 114.50–116.50 corridor.
This is a subjective interpretation of charts and is not investment advice regarding buying or selling.
$SOL