Trading Thesis | 9/24 14:21
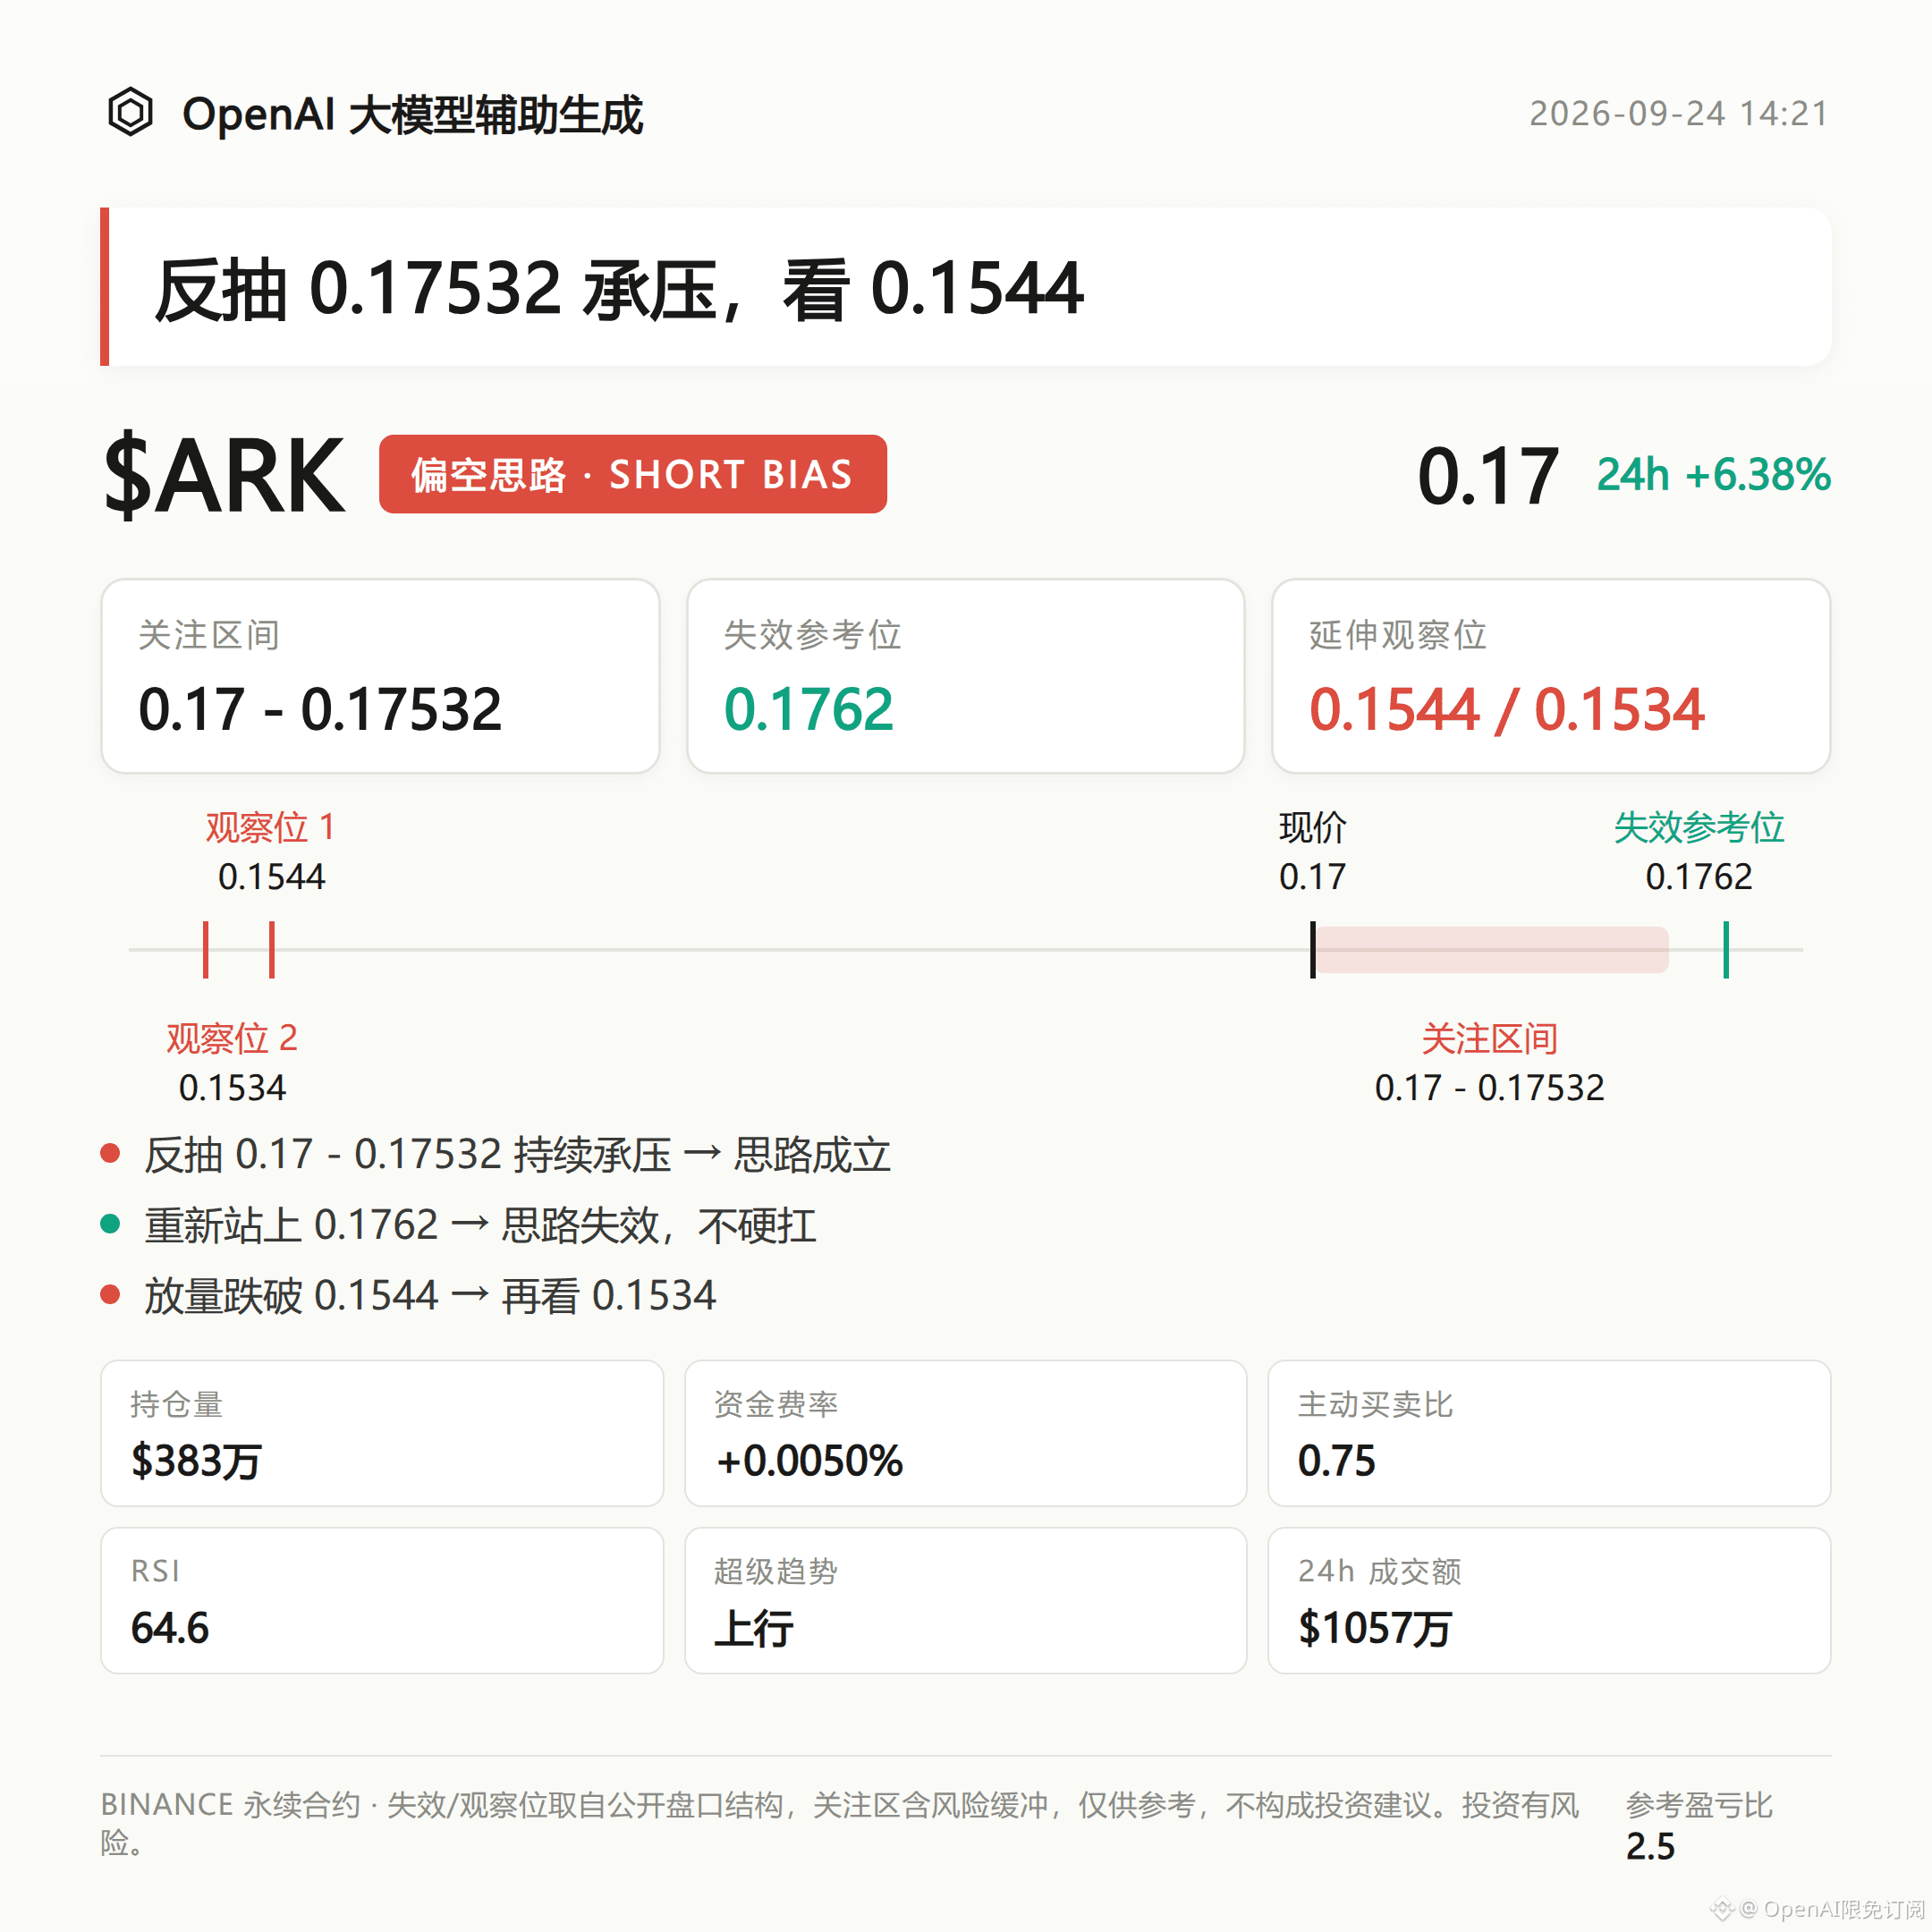
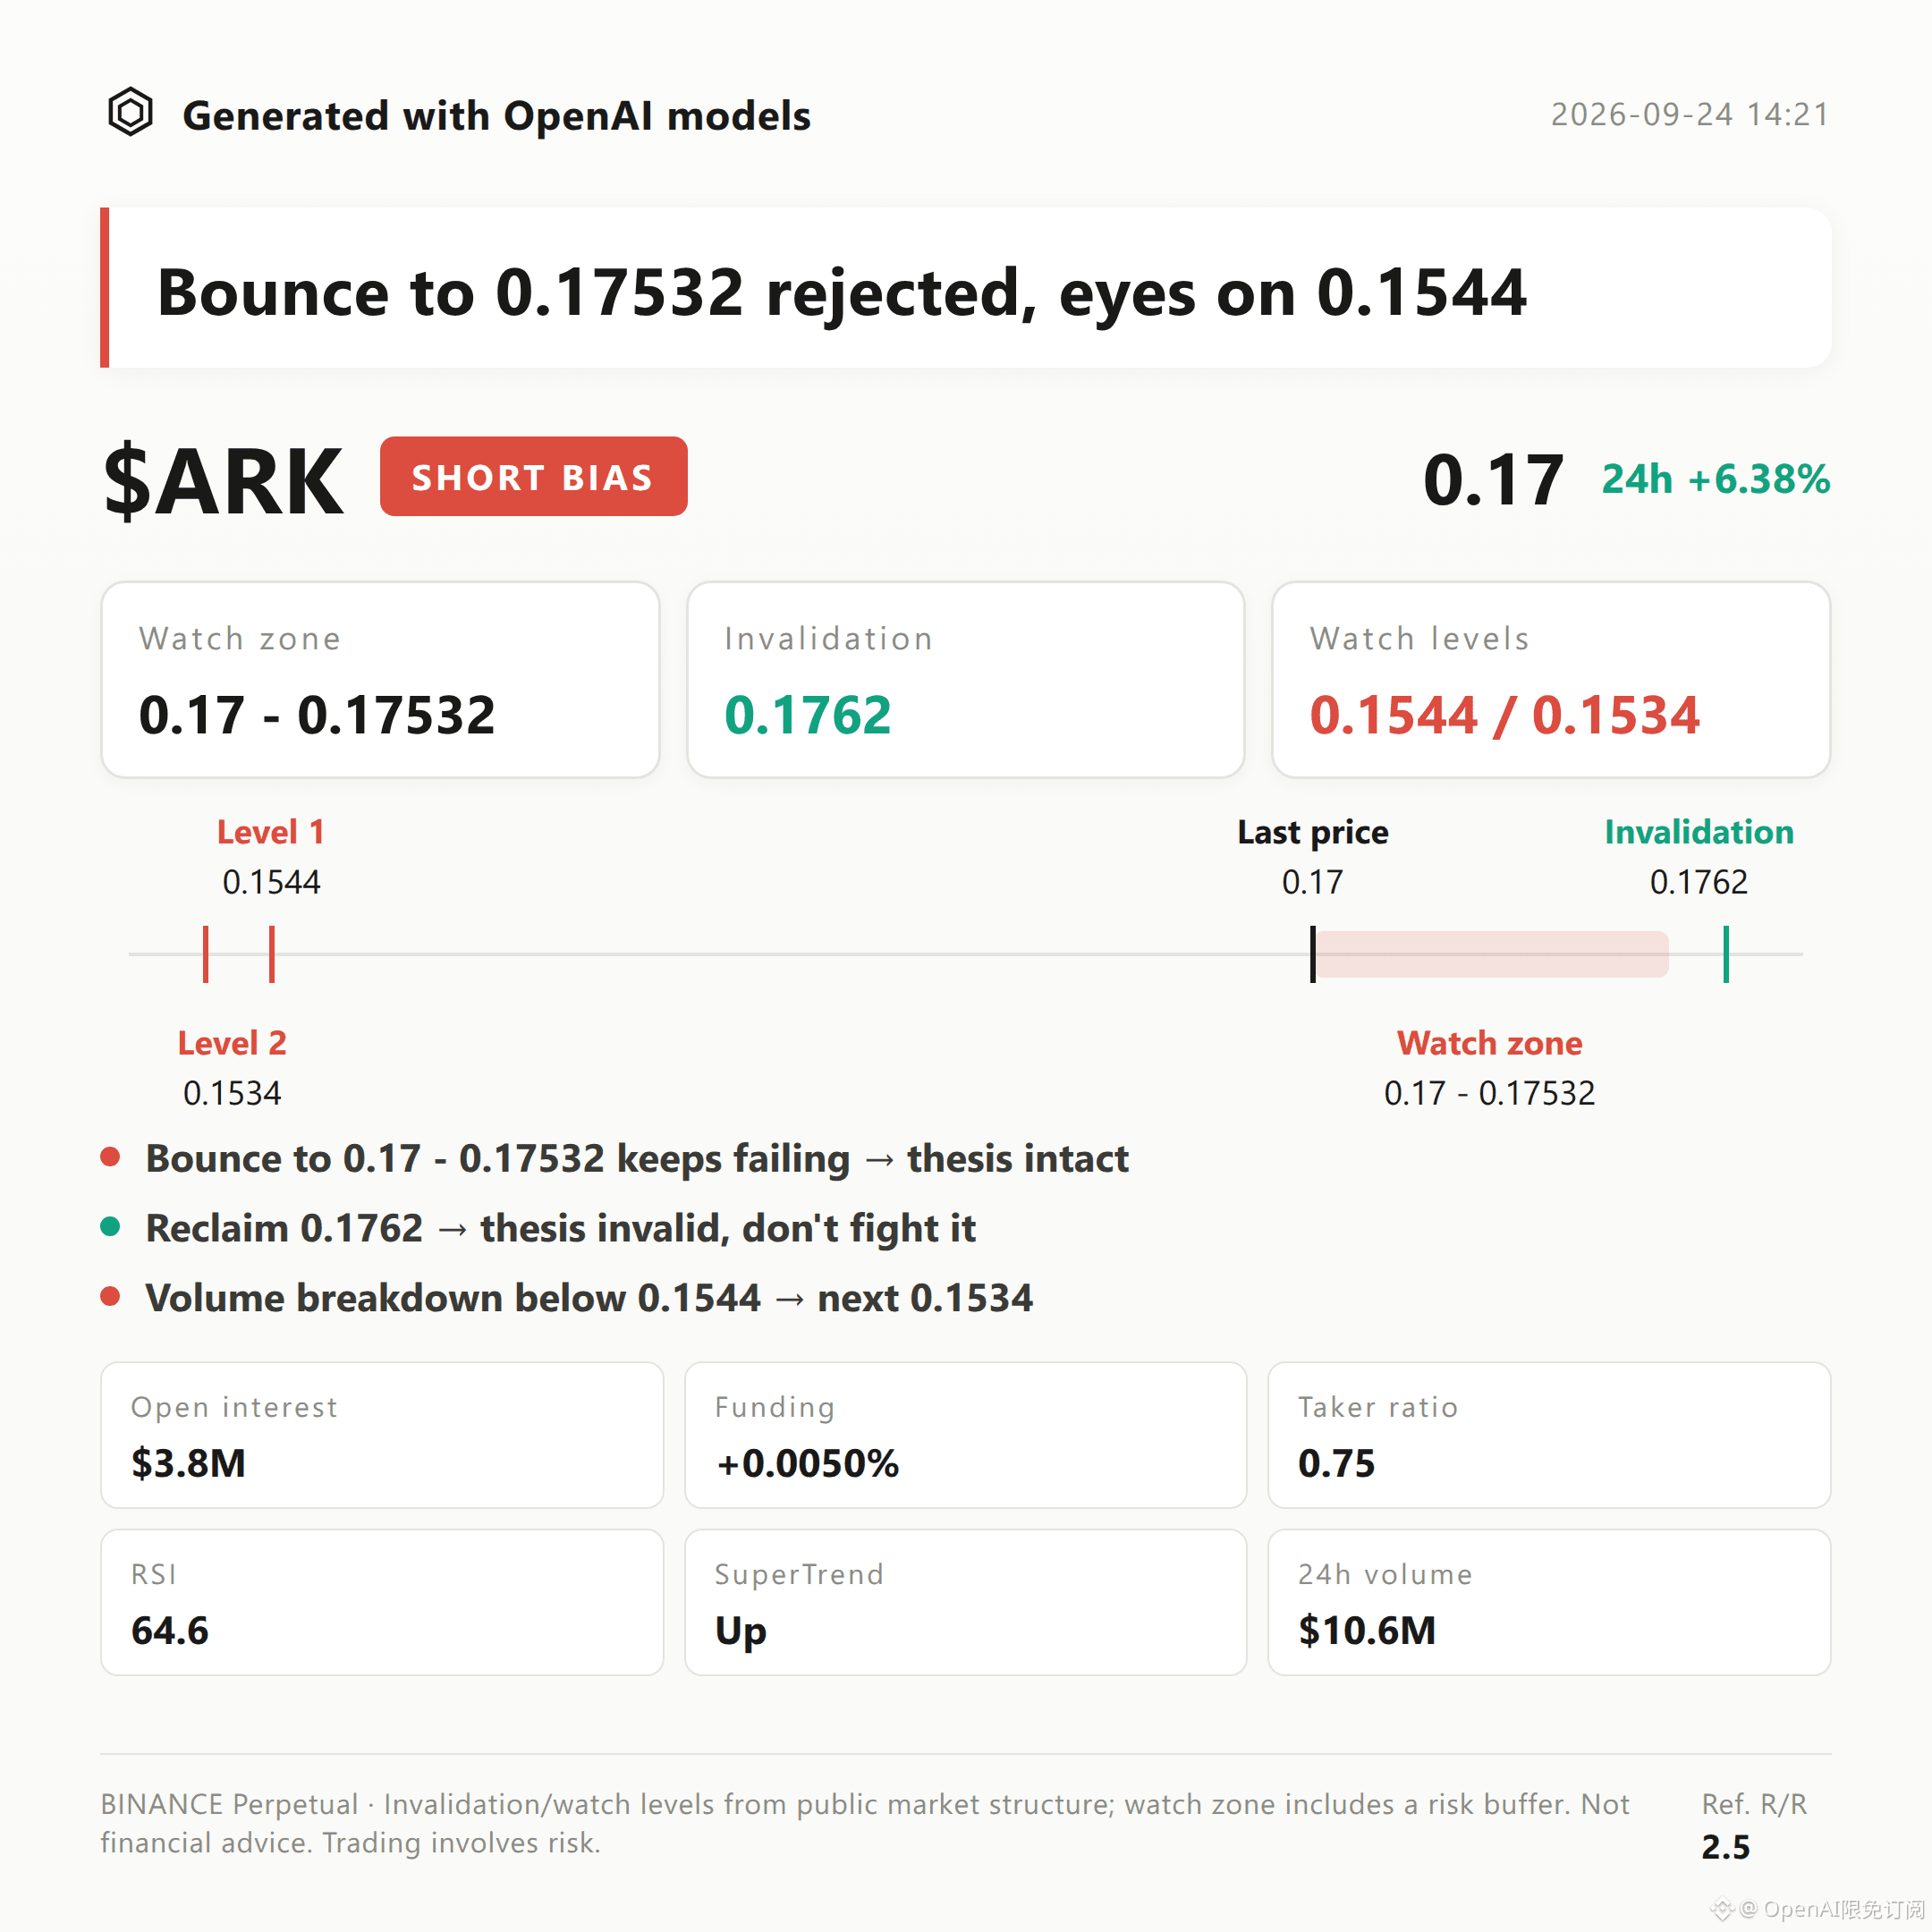
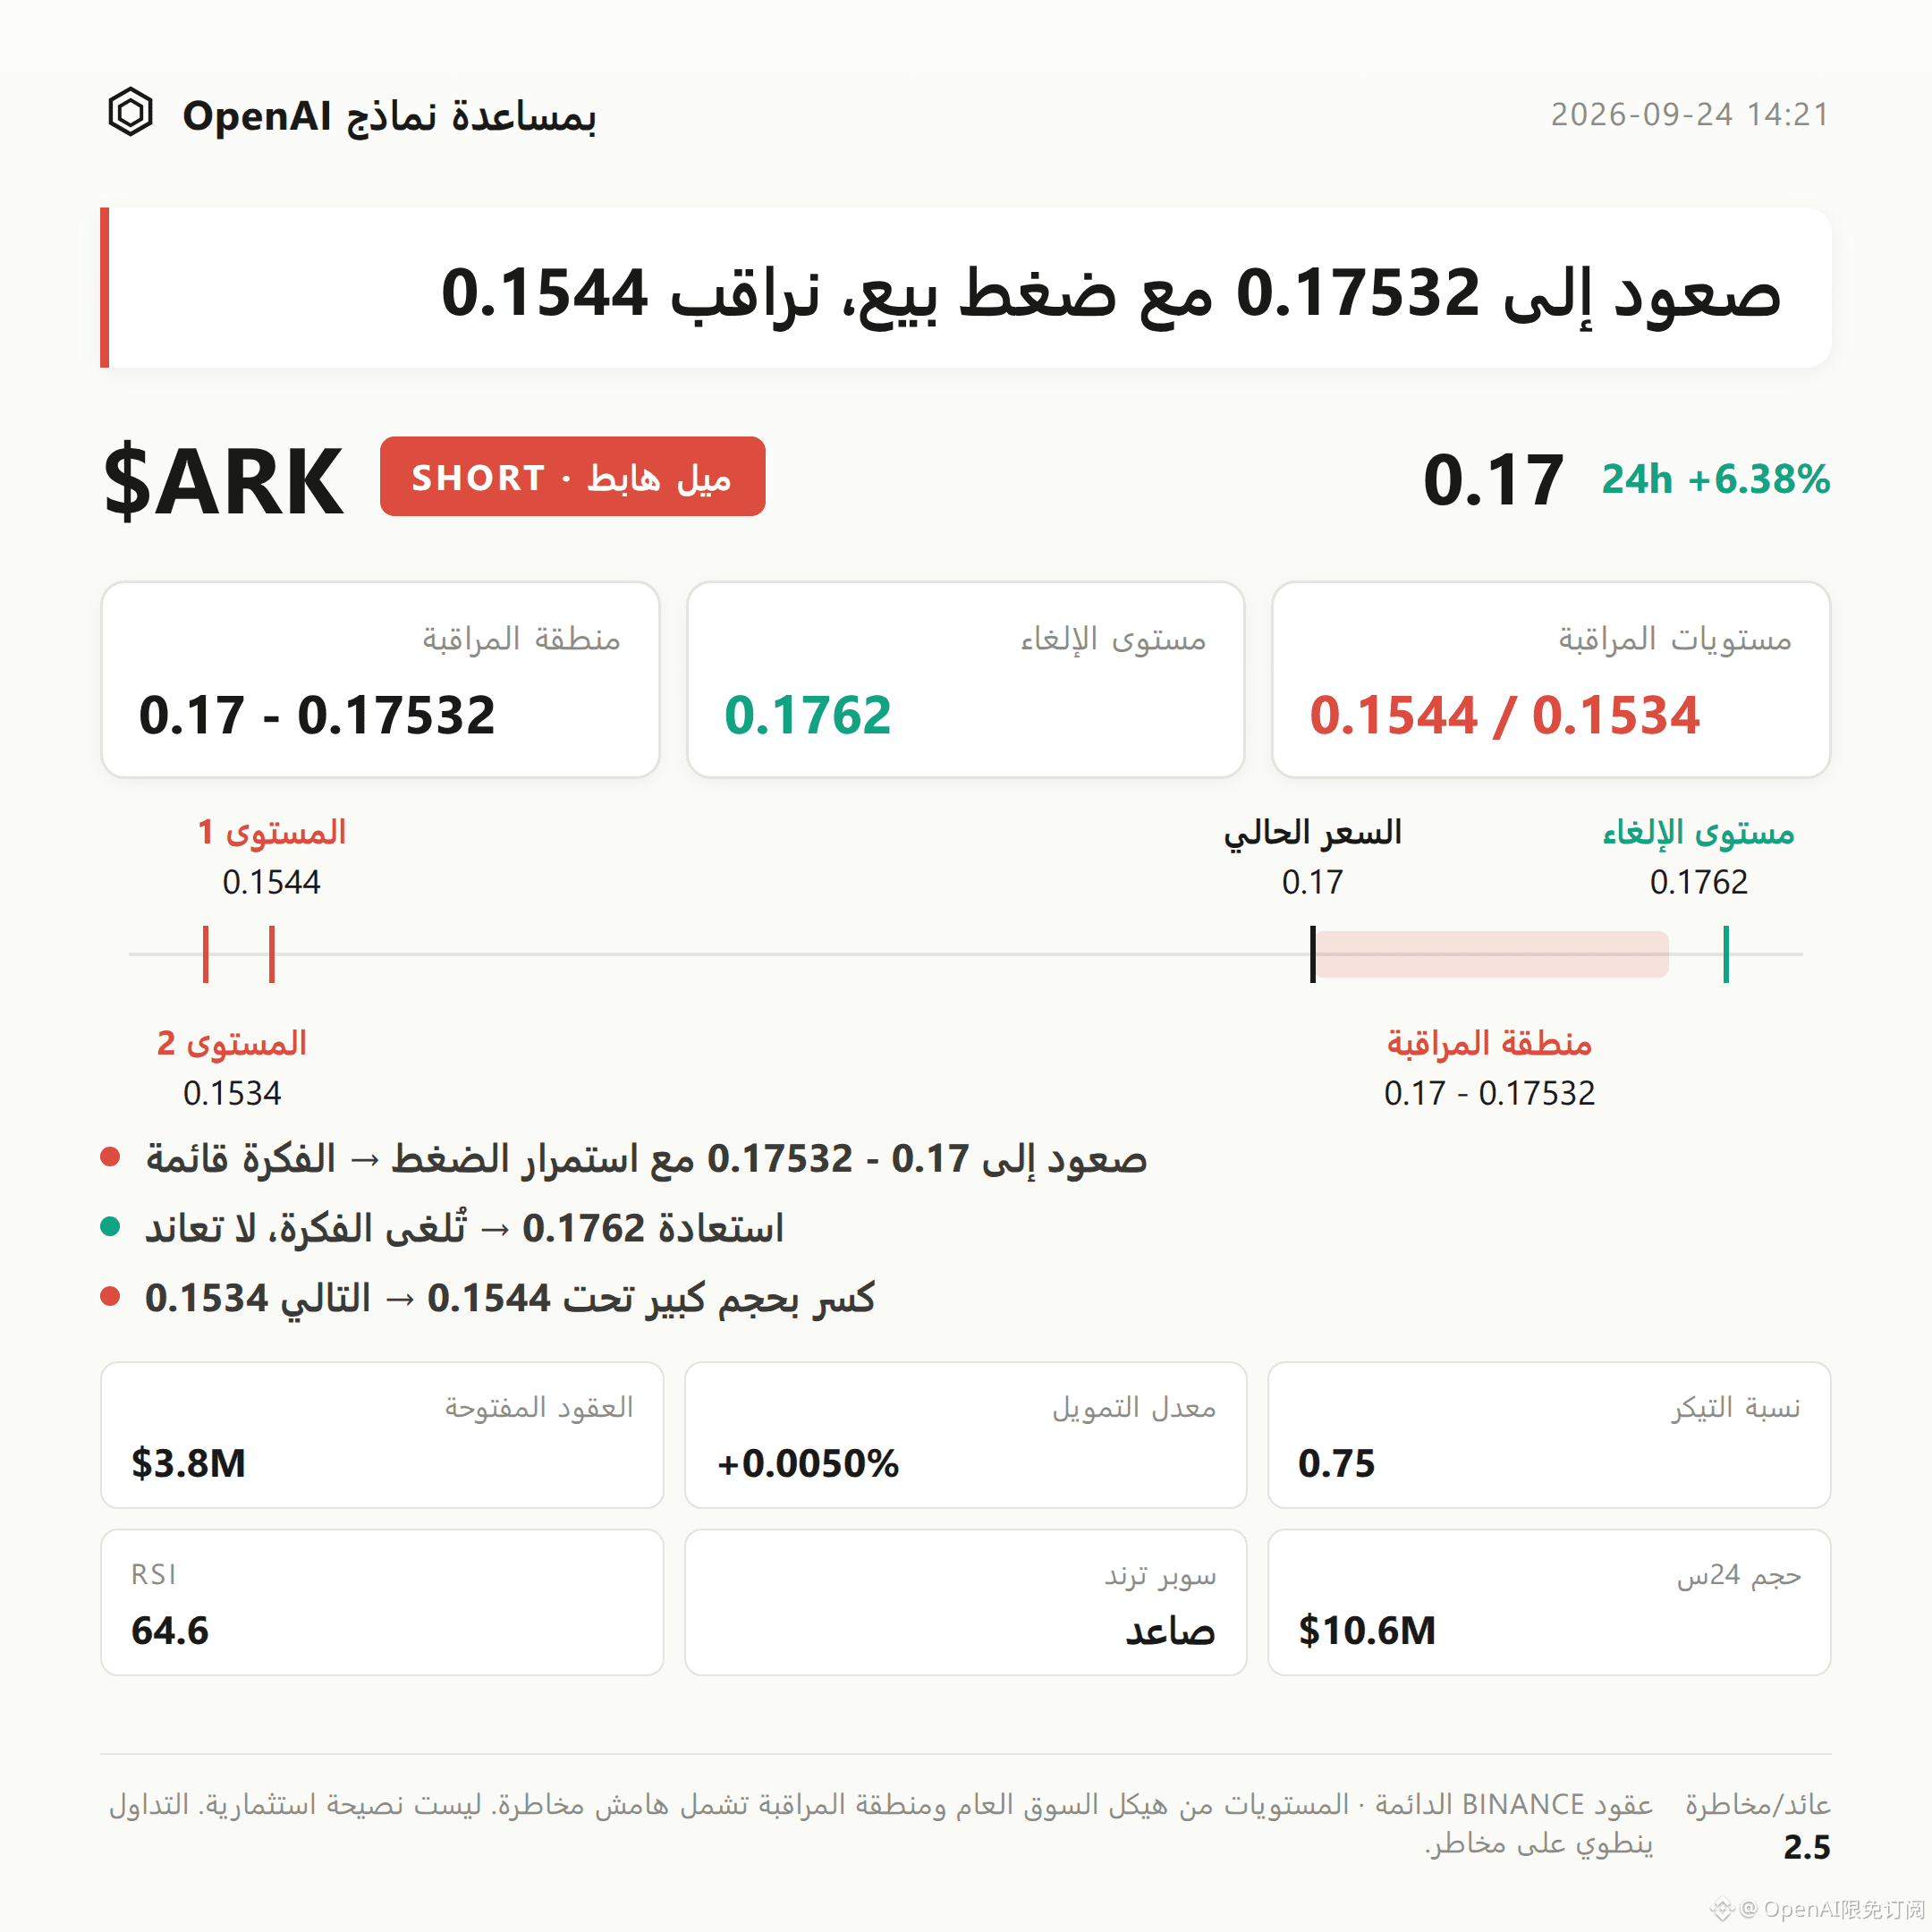
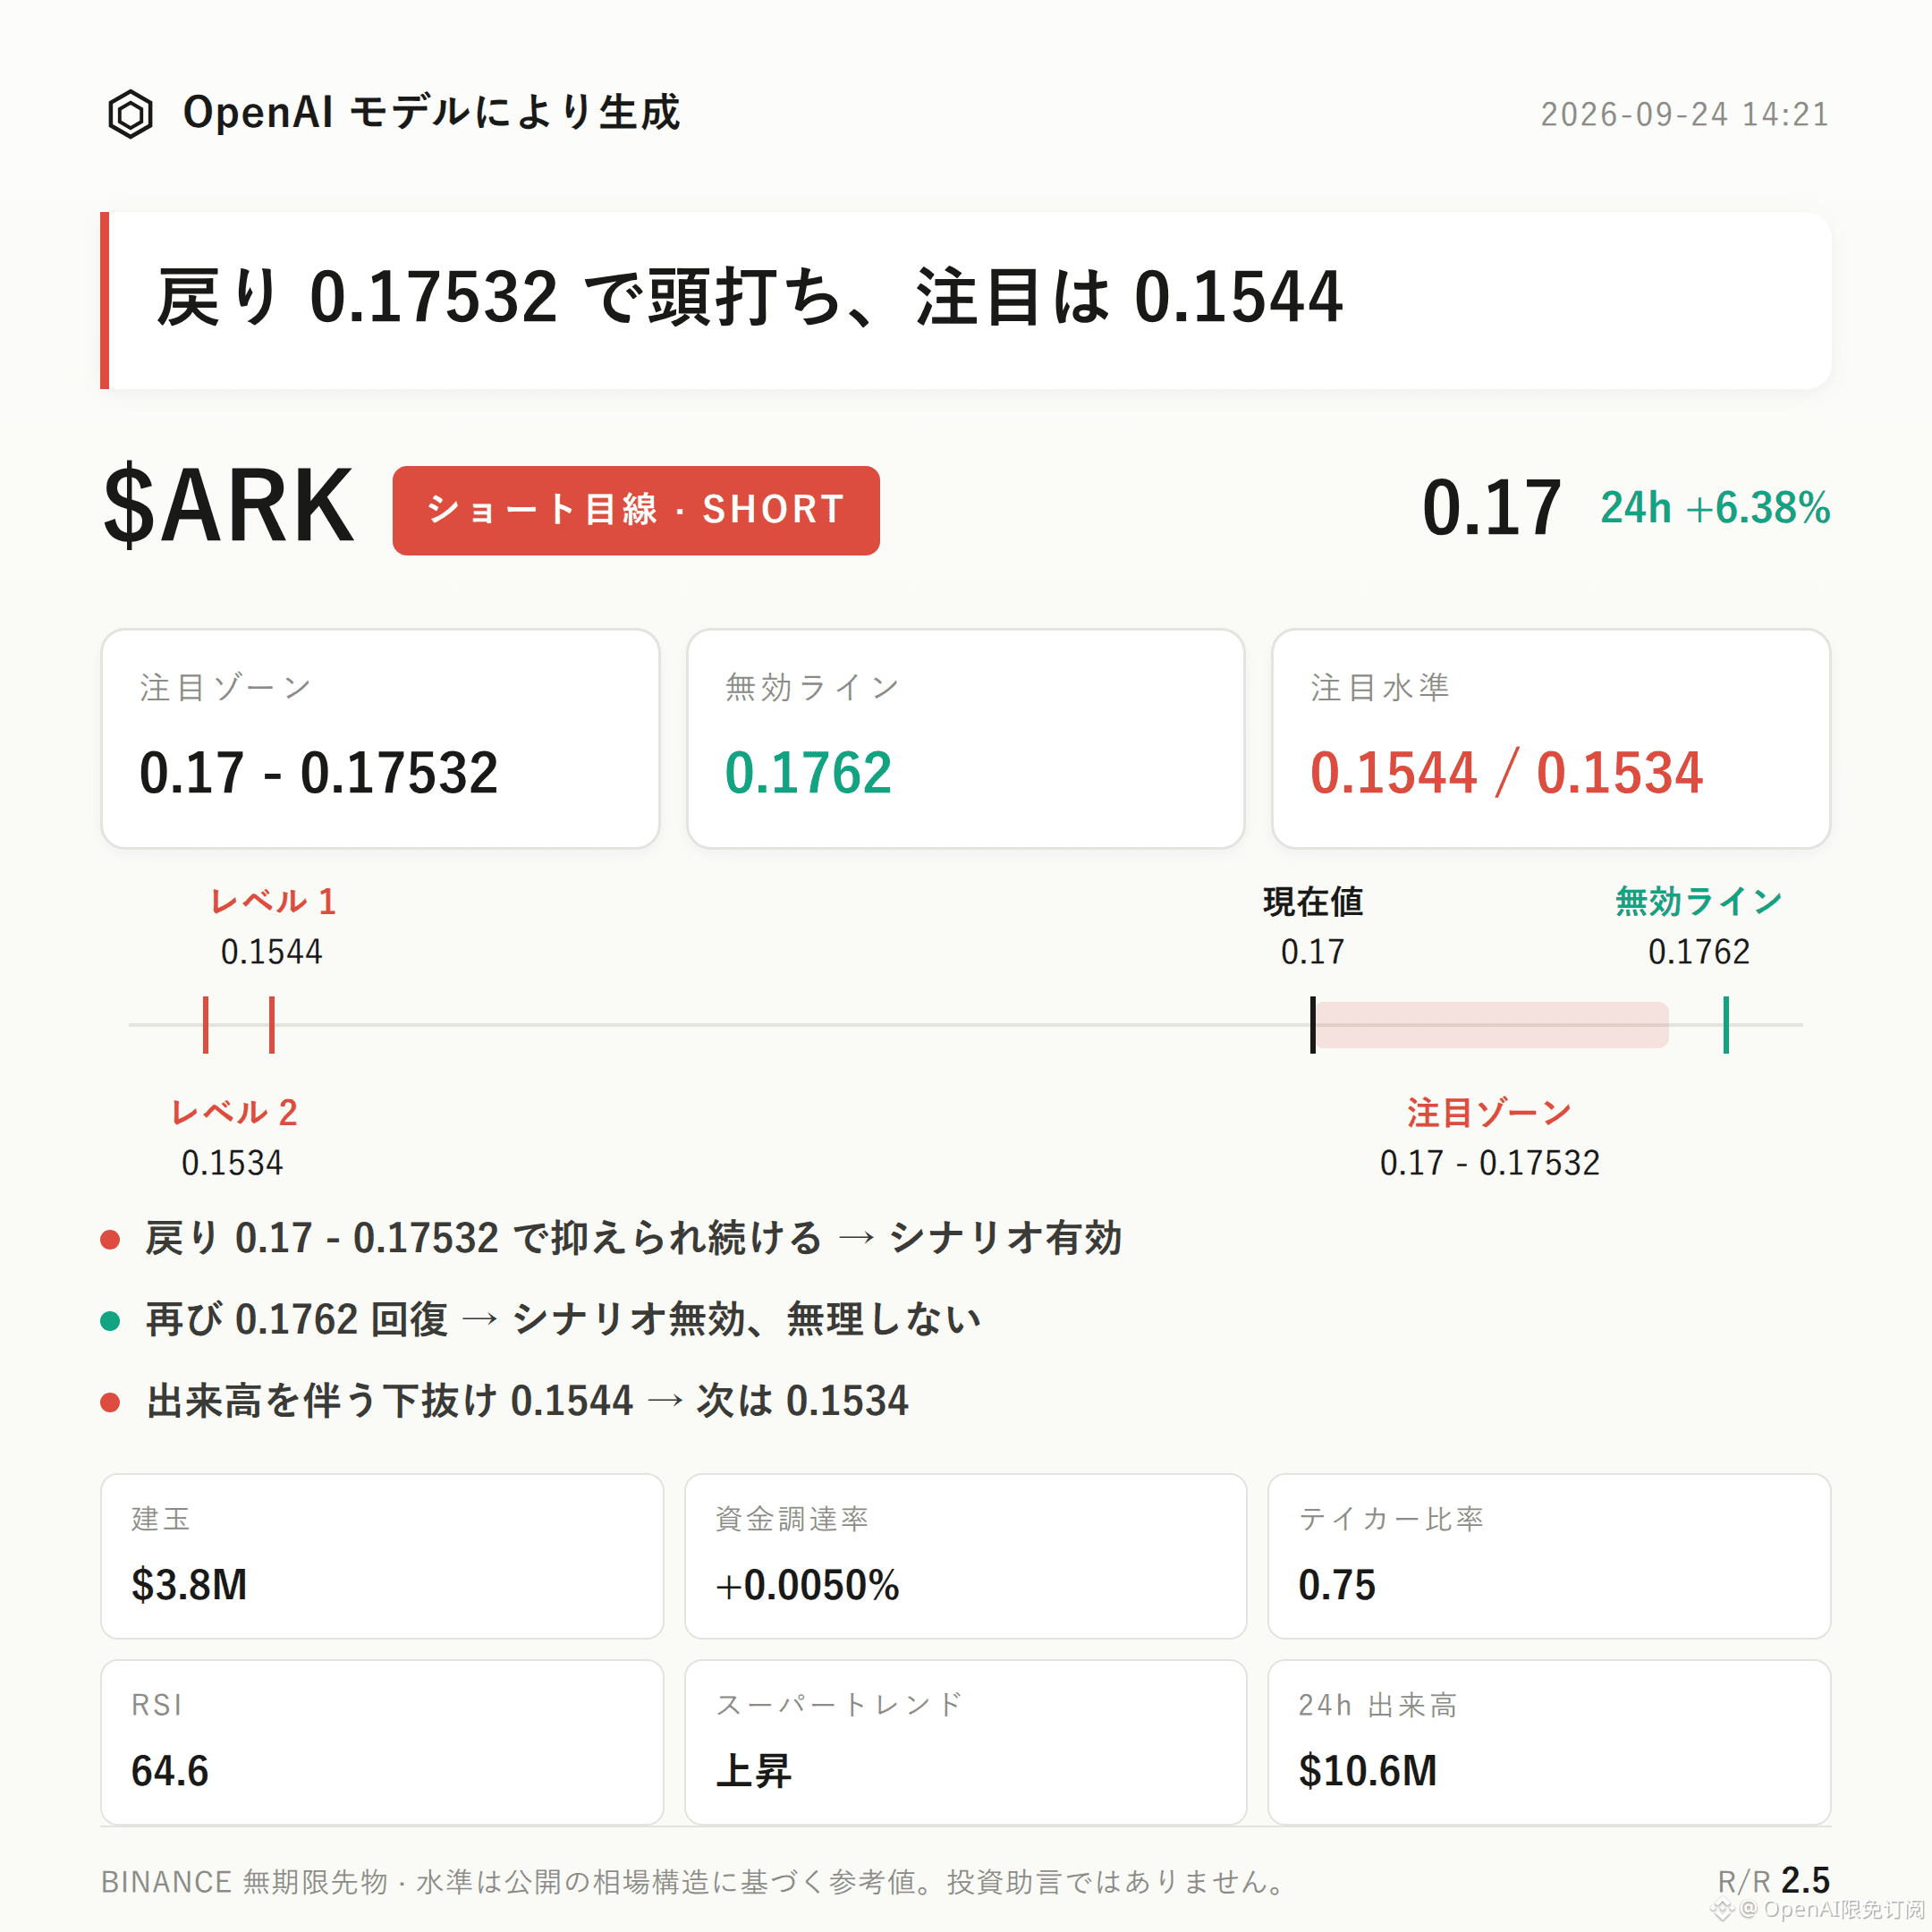
$ARK Bearish Bias | Watch Zone 0.17 - 0.17532 | Invalidation Level 0.1762 | Observation Levels 0.1544 / 0.1534
$ARK is currently moving in a bearish structure.
The core argument has three points: the buy/sell ratio of active trades below 0.75 indicates recent active sell orders have the upper hand; the current price of 0.17 is already close to the upper Bollinger Band (0.1699); and meanwhile, the proportion of long accounts is only 41%, suggesting sentiment has not strengthened in sync with the price.
The key is to watch whether the rebound can be held down in the pressure zone, rather than whether the bullish increase itself can continue.
From the structure: the current price of 0.17 is hugging the upper Bollinger Band at 0.1699; the middle band at 0.1622 and the lower band at 0.1544 form buffers below. Recent swing highs at 0.1762 and lows at 0.1534 bracket the current ranging area.
It’s important to state clearly: the Supertrend is still marked upward, MACD maintains bullish momentum, and RSI is at 64.6—yet to enter an extreme overbought zone. These three indicators, by themselves, are still biased to the upside.
However, when price runs along the upper Bollinger Band, there is often a probability of a pullback after making a spike. This bearish thesis is more based on the logic that the increase has already been achieved in the current stage and the upside room is limited, rather than the trend indicators themselves having already turned bearish.
In derivative data: the funding rate is +0.0050%. Longs are slightly dominant but the edge is mild, with no sign of extreme crowding.
Open interest increased 13.9% over 24 hours to $3.83 million. Since open interest is rising in tandem with price, if the price subsequently pulls back but open interest does not fall correspondingly, be alert to amplified volatility caused by passive long liquidations.
The long/short ratio shows long accounts at 41%; more than half of accounts are still bearish or watching. The active buy/sell ratio of 0.75 points to more active sell orders recently—this is the most direct data support for the bearish judgment in this post.
On reference levels: if price retraces into 0.17 - 0.17532 (the watch zone) and shows signs of failing to rebound under pressure, the bearish thesis can be regarded as valid on a stage basis—it’s better to wait for confirmation rather than chase the price.
If price reclaims 0.1762, it means the current pullback structure has been broken; the bearish thesis is invalid and should not be treated as before.
If the watch zone is lost and it comes with heavy volume pushing the price down, extend the observation to 0.1544 below. Once there is a volume-backed break below 0.1544, then see whether support can form around 0.1534.
The reference risk/reward ratio is about 2.5, for structural reference only and does not represent actual returns.
You need to actively disclose the risk of the opposite outcome: currently, Supertrend, MACD, and RSI have not provided bearish confirmation; bullish momentum is still ongoing. There are no clear adverse technical signals yet. This bearish logic is based more on stage positioning and active sell-order data, not on a trend reversal that has already been confirmed.
If later on volume can keep expanding and price holds above the upper Bollinger Band, the structure could turn stronger again at any time.
Under contract leverage, position discipline is more important than directional judgment.
For reference only and does not constitute investment advice. The contract has leverage—investing involves risk.
This article is generated with assistance from an OpenAI large model.
$ARK # Contract Analysis
$ARK Bearish Bias | Watch Zone 0.17 - 0.17532 | Invalidation Level 0.1762 | Observation Levels 0.1544 / 0.1534
$ARK is currently moving in a bearish structure.
The core argument has three points: the buy/sell ratio of active trades below 0.75 indicates recent active sell orders have the upper hand; the current price of 0.17 is already close to the upper Bollinger Band (0.1699); and meanwhile, the proportion of long accounts is only 41%, suggesting sentiment has not strengthened in sync with the price.
The key is to watch whether the rebound can be held down in the pressure zone, rather than whether the bullish increase itself can continue.
From the structure: the current price of 0.17 is hugging the upper Bollinger Band at 0.1699; the middle band at 0.1622 and the lower band at 0.1544 form buffers below. Recent swing highs at 0.1762 and lows at 0.1534 bracket the current ranging area.
It’s important to state clearly: the Supertrend is still marked upward, MACD maintains bullish momentum, and RSI is at 64.6—yet to enter an extreme overbought zone. These three indicators, by themselves, are still biased to the upside.
However, when price runs along the upper Bollinger Band, there is often a probability of a pullback after making a spike. This bearish thesis is more based on the logic that the increase has already been achieved in the current stage and the upside room is limited, rather than the trend indicators themselves having already turned bearish.
In derivative data: the funding rate is +0.0050%. Longs are slightly dominant but the edge is mild, with no sign of extreme crowding.
Open interest increased 13.9% over 24 hours to $3.83 million. Since open interest is rising in tandem with price, if the price subsequently pulls back but open interest does not fall correspondingly, be alert to amplified volatility caused by passive long liquidations.
The long/short ratio shows long accounts at 41%; more than half of accounts are still bearish or watching. The active buy/sell ratio of 0.75 points to more active sell orders recently—this is the most direct data support for the bearish judgment in this post.
On reference levels: if price retraces into 0.17 - 0.17532 (the watch zone) and shows signs of failing to rebound under pressure, the bearish thesis can be regarded as valid on a stage basis—it’s better to wait for confirmation rather than chase the price.
If price reclaims 0.1762, it means the current pullback structure has been broken; the bearish thesis is invalid and should not be treated as before.
If the watch zone is lost and it comes with heavy volume pushing the price down, extend the observation to 0.1544 below. Once there is a volume-backed break below 0.1544, then see whether support can form around 0.1534.
The reference risk/reward ratio is about 2.5, for structural reference only and does not represent actual returns.
You need to actively disclose the risk of the opposite outcome: currently, Supertrend, MACD, and RSI have not provided bearish confirmation; bullish momentum is still ongoing. There are no clear adverse technical signals yet. This bearish logic is based more on stage positioning and active sell-order data, not on a trend reversal that has already been confirmed.
If later on volume can keep expanding and price holds above the upper Bollinger Band, the structure could turn stronger again at any time.
Under contract leverage, position discipline is more important than directional judgment.
For reference only and does not constitute investment advice. The contract has leverage—investing involves risk.
This article is generated with assistance from an OpenAI large model.
$ARK # Contract Analysis