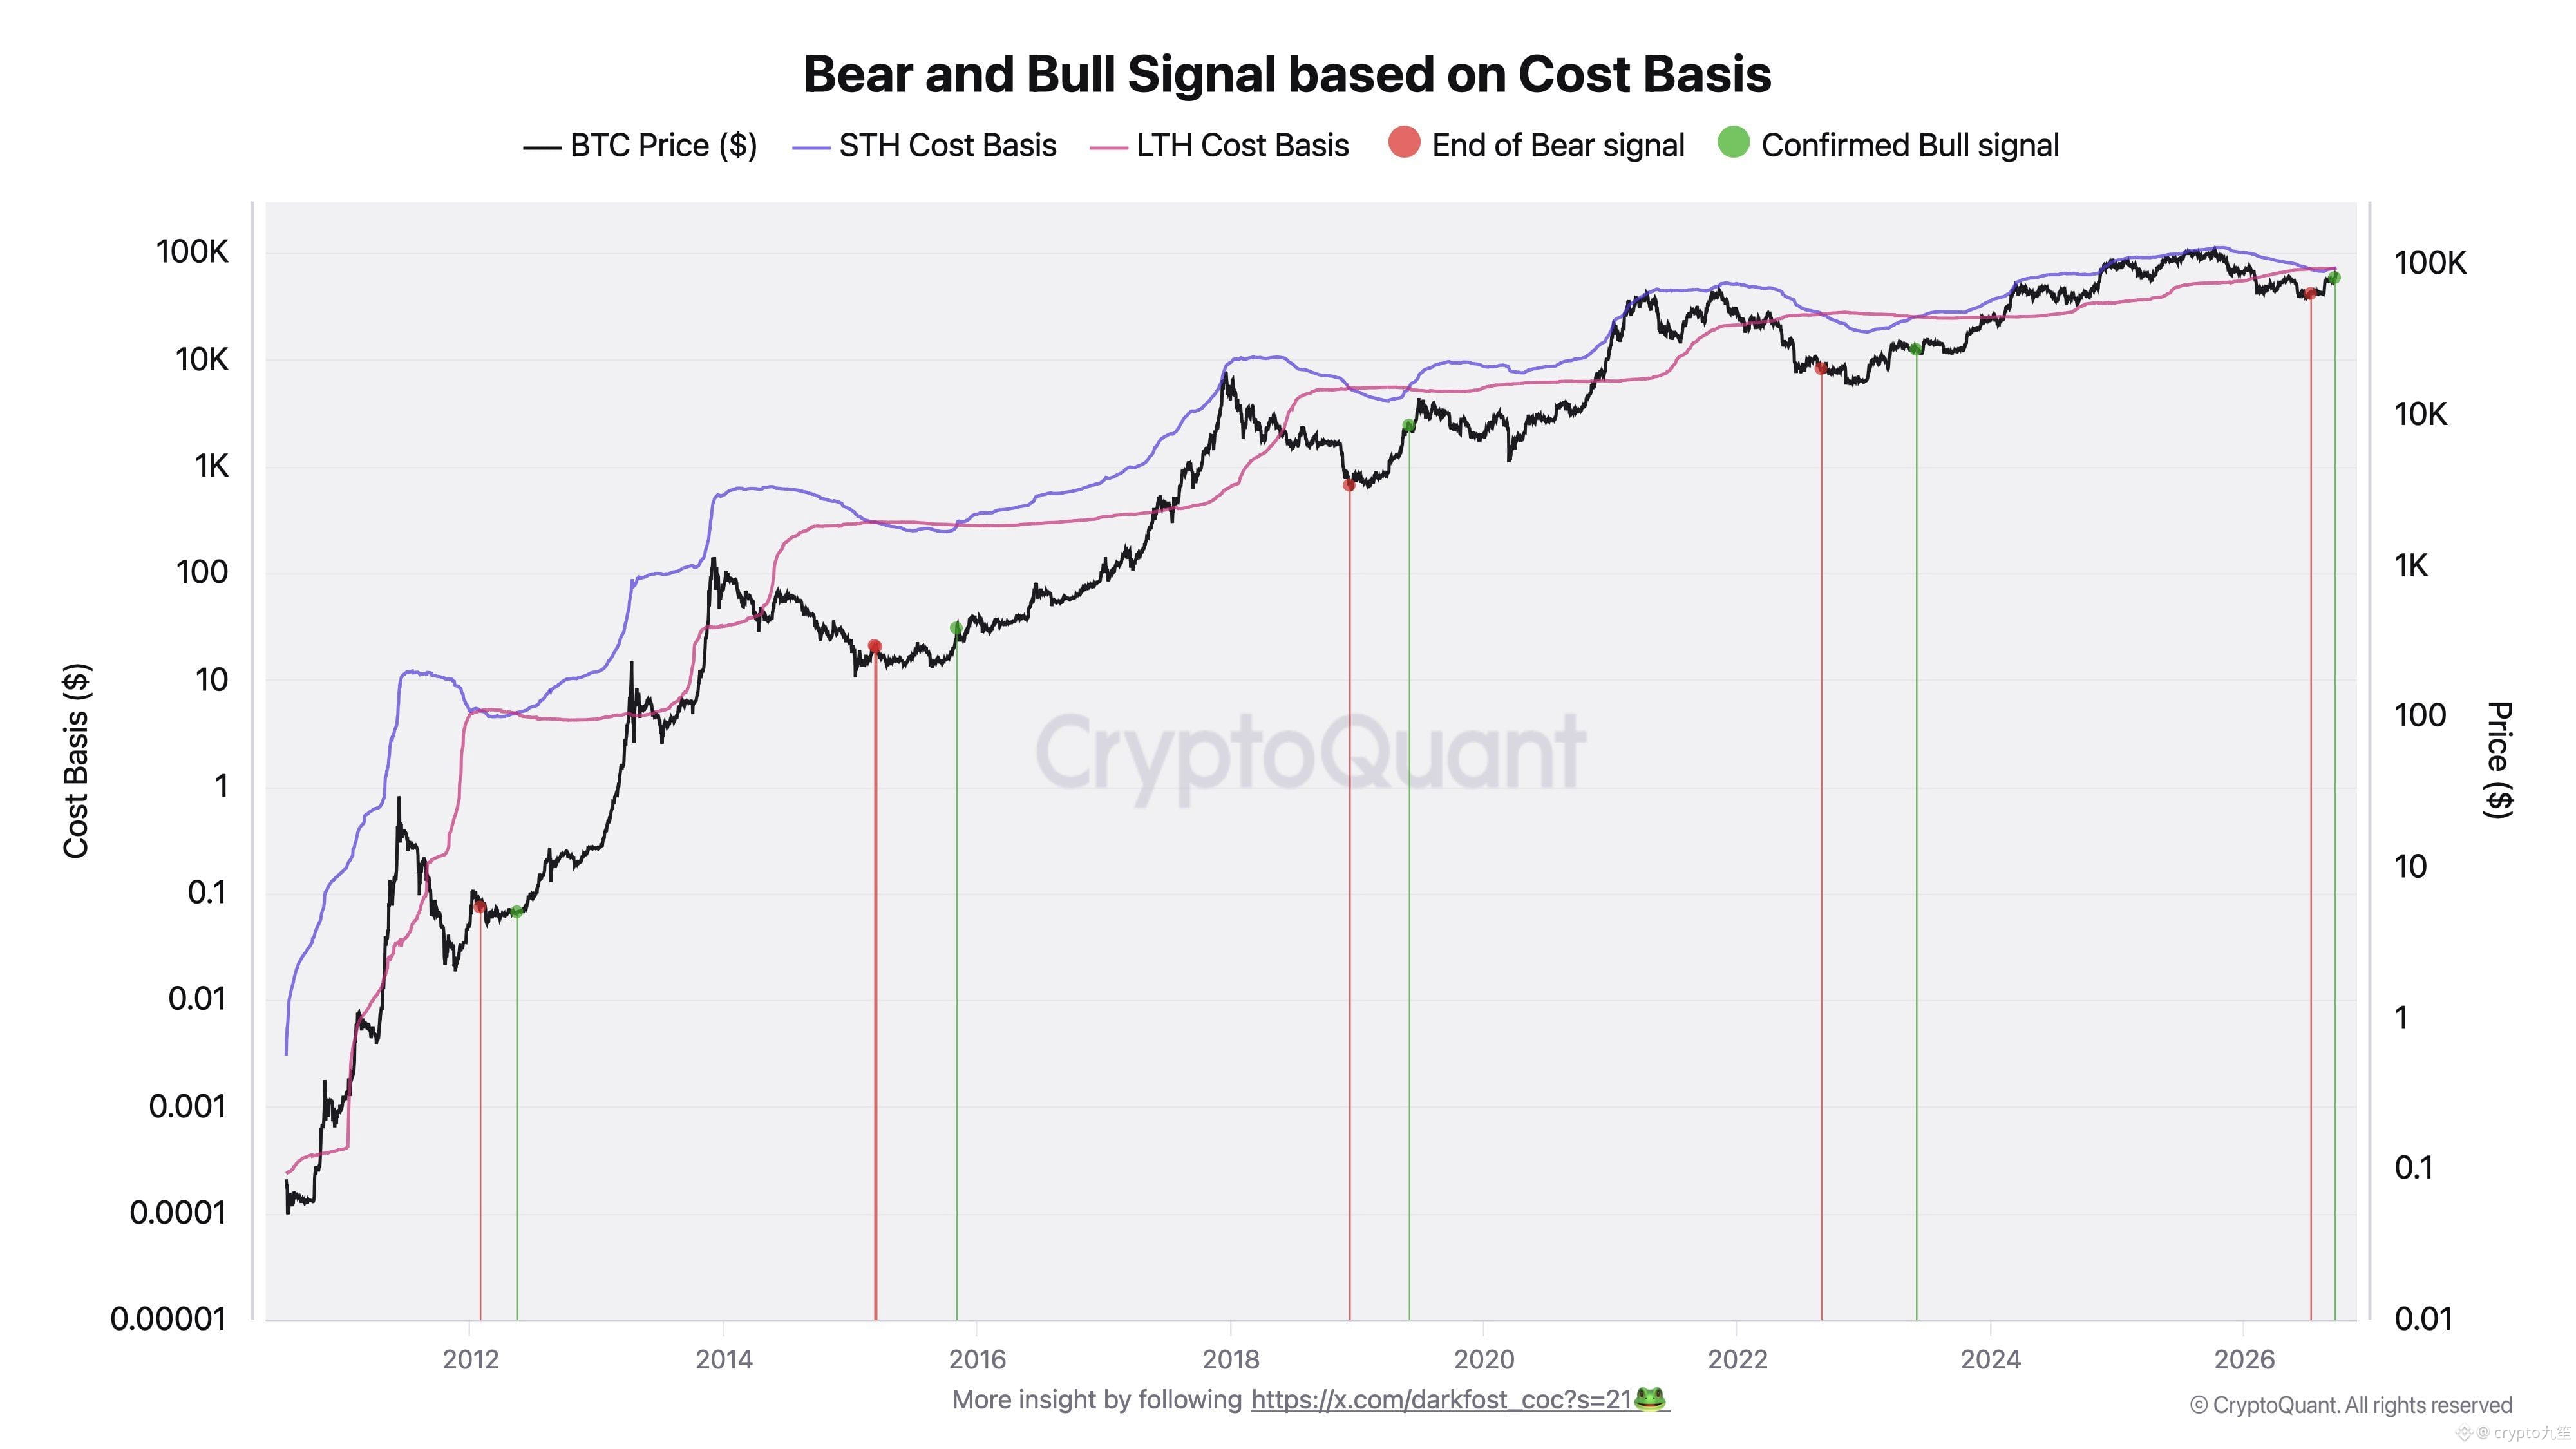
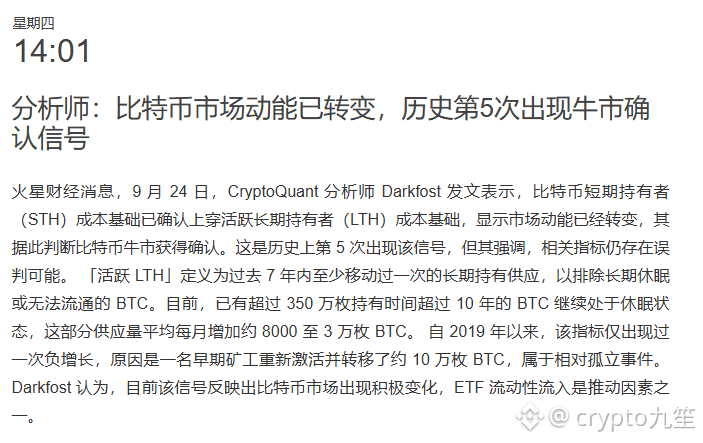
✅ Bull market confirmed.
The appearance of this signal (STH cost line surpassing the active LTH cost line) fundamentally reflects the process of capital moving from long-term holders to short-term newly entered funds. It is also an important characteristic of improving turnover rate and liquidity.
My takeaways:
1. Momentum confirmation vs. lagging indicators:
The historical 5th occurrence does have statistical significance, indicating that newly entering capital (including net ETF inflows) is taking the offer and pushing up the average price, with more active trading. However, note that such cost-line crossovers are typically lagging confirmation signals. They are more a validation that the “trend has already formed,” rather than a prediction of “a sudden surge upward.”
2. Structural support is stronger than in prior periods:
Currently, there are 3.5 million+ BTC locked for over 10 years. Combined with the fact that ETFs provide a more compliant and steadier liquidity base than in previous bull runs, the supply-overhang structure is healthier than in the past.
3. Beware the probability of misinterpretation:
The “risk of misjudgment” mentioned by analysts is not baseless. Global macro liquidity (such as the Fed’s rate-cut timeline) remains the biggest external variable. Focusing blindly on a single on-chain metric may cause macro risks to be overlooked.
Overall, the market fundamentals are improving. But instead of chasing the price, it’s better to view this as a signal that the medium- to long-term trend has been established. Staying rational and coordinating with risk control is the key.
The appearance of this signal (STH cost line surpassing the active LTH cost line) fundamentally reflects the process of capital moving from long-term holders to short-term newly entered funds. It is also an important characteristic of improving turnover rate and liquidity.
My takeaways:
1. Momentum confirmation vs. lagging indicators:
The historical 5th occurrence does have statistical significance, indicating that newly entering capital (including net ETF inflows) is taking the offer and pushing up the average price, with more active trading. However, note that such cost-line crossovers are typically lagging confirmation signals. They are more a validation that the “trend has already formed,” rather than a prediction of “a sudden surge upward.”
2. Structural support is stronger than in prior periods:
Currently, there are 3.5 million+ BTC locked for over 10 years. Combined with the fact that ETFs provide a more compliant and steadier liquidity base than in previous bull runs, the supply-overhang structure is healthier than in the past.
3. Beware the probability of misinterpretation:
The “risk of misjudgment” mentioned by analysts is not baseless. Global macro liquidity (such as the Fed’s rate-cut timeline) remains the biggest external variable. Focusing blindly on a single on-chain metric may cause macro risks to be overlooked.
Overall, the market fundamentals are improving. But instead of chasing the price, it’s better to view this as a signal that the medium- to long-term trend has been established. Staying rational and coordinating with risk control is the key.