📉 TECHNICAL CORRECTION IN BNB: LOOKING FOR SUPPORT IN THE MIDDLE OF AN UPTREND! ⚡
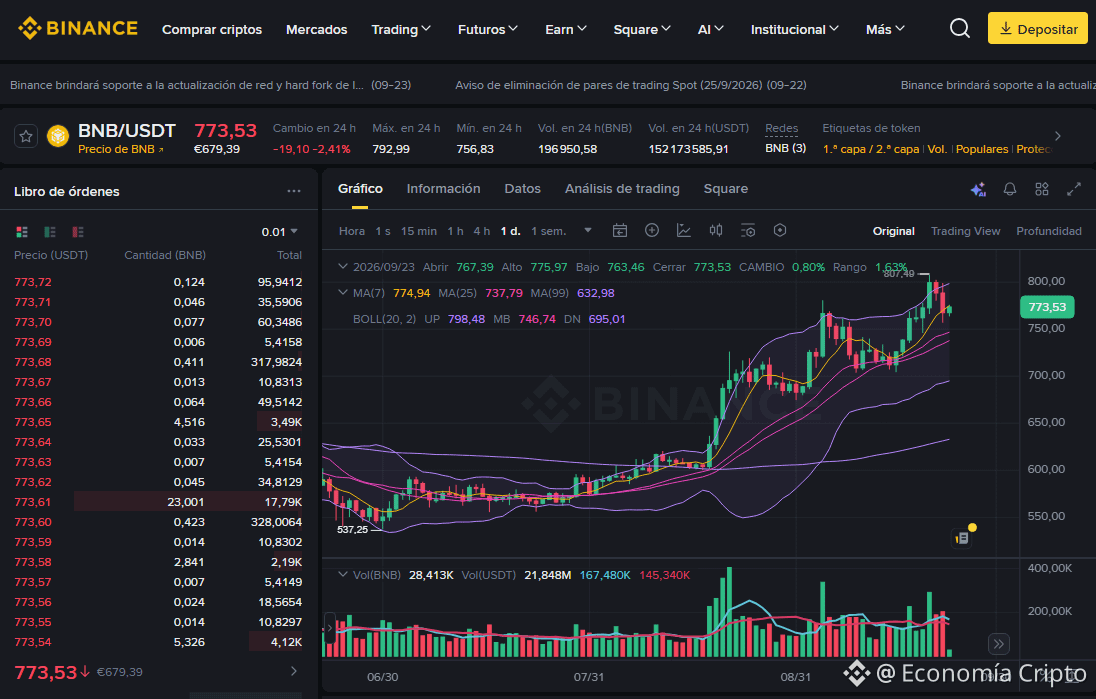
The BNB/USDT pair is trading at 773.53, recording a -2.41% pullback over the last 24 hours. The daily session shows an opening at 767.39, a high of 775.97, a low of 763.46, and a current level of 773.53 (+0.80% in the daily variation), reflecting a cooling-off phase and short-term adjustment after the recent highs.
🔍 Trend Analysis and Indicators
Trend: Short-term technical correction within a broader bullish structure.
Moving Averages: The price is very close to the MA(7) (774.94), while remaining strongly above the MA(25) (737.79) and the long-term macro trend with the MA(99) (632.98).
Bollinger Bands: The quote is retreating from the upper UP zone (798.48) toward the middle band MB (746.74), with the lower band located at DN (695.01).
Key Levels: Immediate support is consolidating in the 763 - 767 area, while the main resistance to break is located near the recent highs around 792 - 798.
💡 Trading Strategy: Buy or Sell?
Buy (Long)?: This technical correction offers an attractive opportunity to evaluate tactical entries if the price manages to consolidate above the current support levels, while managing risk strictly.
Sell (Short)?: Going short involves higher risk due to the strength of the medium- and long-term moving averages; it would only be considered in the event of a deep and sustained loss of the lower support levels.
#AnalisisTecnico #CryptoTrading #AIStocksWhatNext
May the Lord bless and prosper whoever operates here, in the name of Jesus, because your word says: "Mine is the silver, and mine is the gold," says the LORD of hosts. Hageo 2:8 RV1960-T -
$BNB
The BNB/USDT pair is trading at 773.53, recording a -2.41% pullback over the last 24 hours. The daily session shows an opening at 767.39, a high of 775.97, a low of 763.46, and a current level of 773.53 (+0.80% in the daily variation), reflecting a cooling-off phase and short-term adjustment after the recent highs.
🔍 Trend Analysis and Indicators
Trend: Short-term technical correction within a broader bullish structure.
Moving Averages: The price is very close to the MA(7) (774.94), while remaining strongly above the MA(25) (737.79) and the long-term macro trend with the MA(99) (632.98).
Bollinger Bands: The quote is retreating from the upper UP zone (798.48) toward the middle band MB (746.74), with the lower band located at DN (695.01).
Key Levels: Immediate support is consolidating in the 763 - 767 area, while the main resistance to break is located near the recent highs around 792 - 798.
💡 Trading Strategy: Buy or Sell?
Buy (Long)?: This technical correction offers an attractive opportunity to evaluate tactical entries if the price manages to consolidate above the current support levels, while managing risk strictly.
Sell (Short)?: Going short involves higher risk due to the strength of the medium- and long-term moving averages; it would only be considered in the event of a deep and sustained loss of the lower support levels.
#AnalisisTecnico #CryptoTrading #AIStocksWhatNext
May the Lord bless and prosper whoever operates here, in the name of Jesus, because your word says: "Mine is the silver, and mine is the gold," says the LORD of hosts. Hageo 2:8 RV1960-T -
$BNB