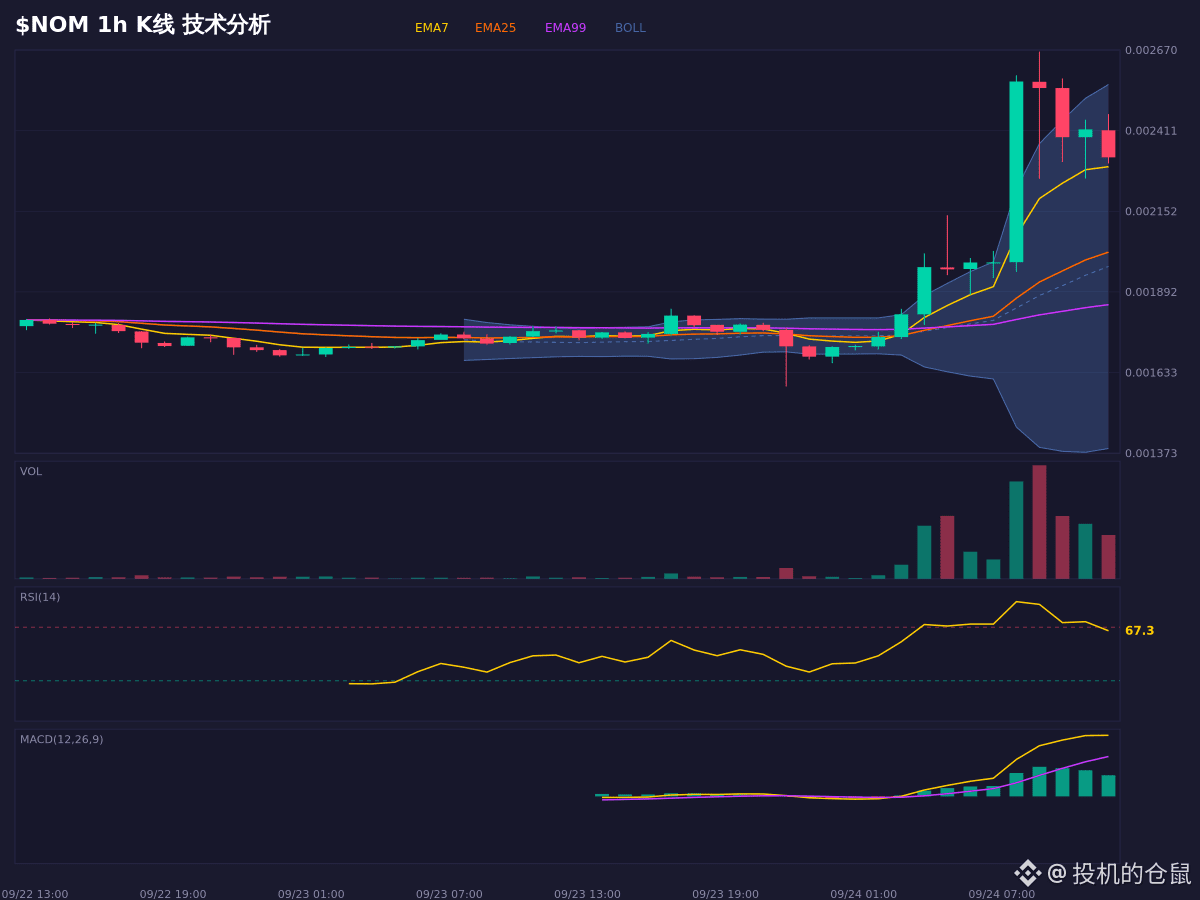
$NOM This 37% surge is indeed scary, but looking closely at the technicals there’s something interesting. The price makes new highs, yet the RSI doesn’t follow, forming a top divergence. Coupled with a Stoch RSI bearish cross and OBV showing capital outflow, it suggests that short-term selling pressure is increasing. Although the multi-timeframe moving-average trend remains bullish with a long-term uptrend intact, the risk of chasing gains is not small.
If support can be found in the 0.00225–0.00241 range, the bullish structure may continue; if there is a valid breakdown below 0.00193, then the current logic needs to be reassessed.
For viewing the chart and scenario analysis only—does not constitute a record of trading actions.
$NOM #行情分析 #交易 #bear market
If support can be found in the 0.00225–0.00241 range, the bullish structure may continue; if there is a valid breakdown below 0.00193, then the current logic needs to be reassessed.
For viewing the chart and scenario analysis only—does not constitute a record of trading actions.
$NOM #行情分析 #交易 #bear market