📉➡️📈 BTC on Weekly: The "pause" is over—will a big rebound be next?
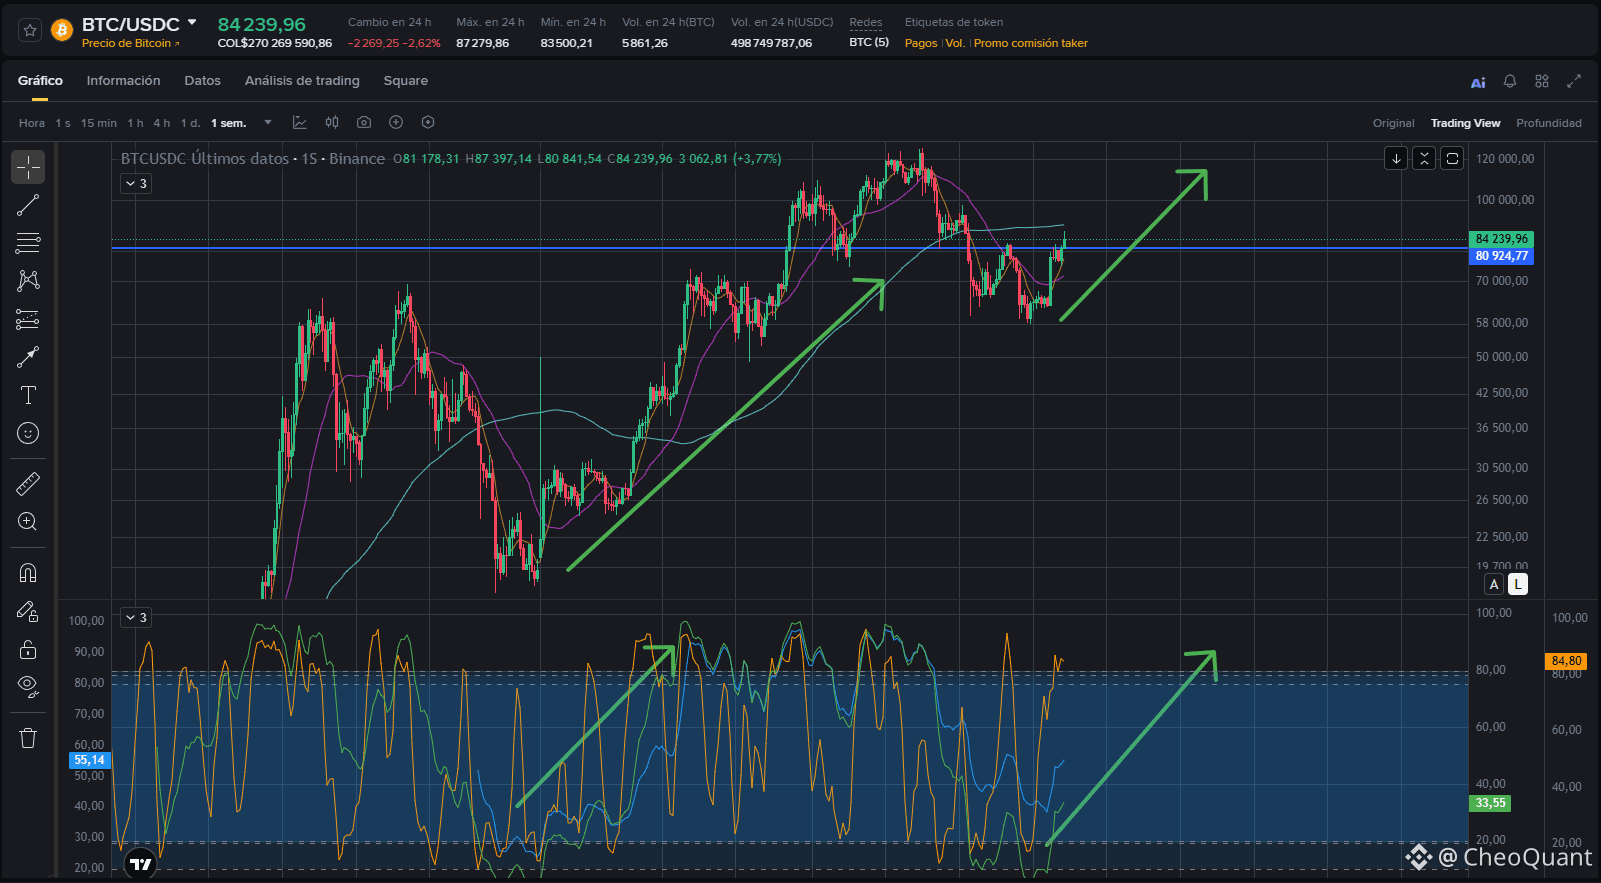
Friends, today I want to share a more macro view. Sometimes we get lost in the 4H or 1H noise, but Bitcoin’s weekly chart gives a very clear perspective: the main bullish uptrend is still intact, and price is setting up for the next impulse.
🔍 What I see on the chart:
Macro support: After the correction from all-time highs, BTC found firm buyers in the $75K-$80K area. It’s currently trading at ~ $84,239, holding just above the blue structural support line at $80,974.
RSI is the key: Look at the lower indicator. The RSI has cooled down, coming out of the oversold zone and bouncing upward (currently at 55.14). This means the asset still has plenty of room to grow before returning to overbought conditions. The green arrow I drew projects that next move.
Structure of "higher lows": The drop didn’t break the structure. If price keeps the $80K support on the weekly close, the path toward new highs is mathematically alive.
🎯 Scenarios to watch:
Bullish (Breakout): If we see a solid weekly close above $86K-$87K, the way opens toward $95K and eventually a hunt for previous highs (the $100K+ zone), as indicated by the green projection arrow.
Neutral/Correction: A pullback to the $78K-$80K zone would be a healthy "retest." As long as we don’t lose $75K on the weekly, I consider it an accumulation opportunity, not a panic signal.
💡 My take as an enthusiast:
The market often presents opportunities when fear is around. As I always say, I’m not a financial advisor—I’m only sharing what I see on the candles. NFA. DYOR. 🧠
What do you think? Will we break $90K this week, or will we keep ranging?
And as always, if you want me to analyze another crypto, leave it in the comments! 👇
$BTC #bitcoin in #Crypto #Binance anceSquare #Trading #analises isTécnico #Macro
Friends, today I want to share a more macro view. Sometimes we get lost in the 4H or 1H noise, but Bitcoin’s weekly chart gives a very clear perspective: the main bullish uptrend is still intact, and price is setting up for the next impulse.
🔍 What I see on the chart:
Macro support: After the correction from all-time highs, BTC found firm buyers in the $75K-$80K area. It’s currently trading at ~ $84,239, holding just above the blue structural support line at $80,974.
RSI is the key: Look at the lower indicator. The RSI has cooled down, coming out of the oversold zone and bouncing upward (currently at 55.14). This means the asset still has plenty of room to grow before returning to overbought conditions. The green arrow I drew projects that next move.
Structure of "higher lows": The drop didn’t break the structure. If price keeps the $80K support on the weekly close, the path toward new highs is mathematically alive.
🎯 Scenarios to watch:
Bullish (Breakout): If we see a solid weekly close above $86K-$87K, the way opens toward $95K and eventually a hunt for previous highs (the $100K+ zone), as indicated by the green projection arrow.
Neutral/Correction: A pullback to the $78K-$80K zone would be a healthy "retest." As long as we don’t lose $75K on the weekly, I consider it an accumulation opportunity, not a panic signal.
💡 My take as an enthusiast:
The market often presents opportunities when fear is around. As I always say, I’m not a financial advisor—I’m only sharing what I see on the candles. NFA. DYOR. 🧠
What do you think? Will we break $90K this week, or will we keep ranging?
And as always, if you want me to analyze another crypto, leave it in the comments! 👇
$BTC #bitcoin in #Crypto #Binance anceSquare #Trading #analises isTécnico #Macro