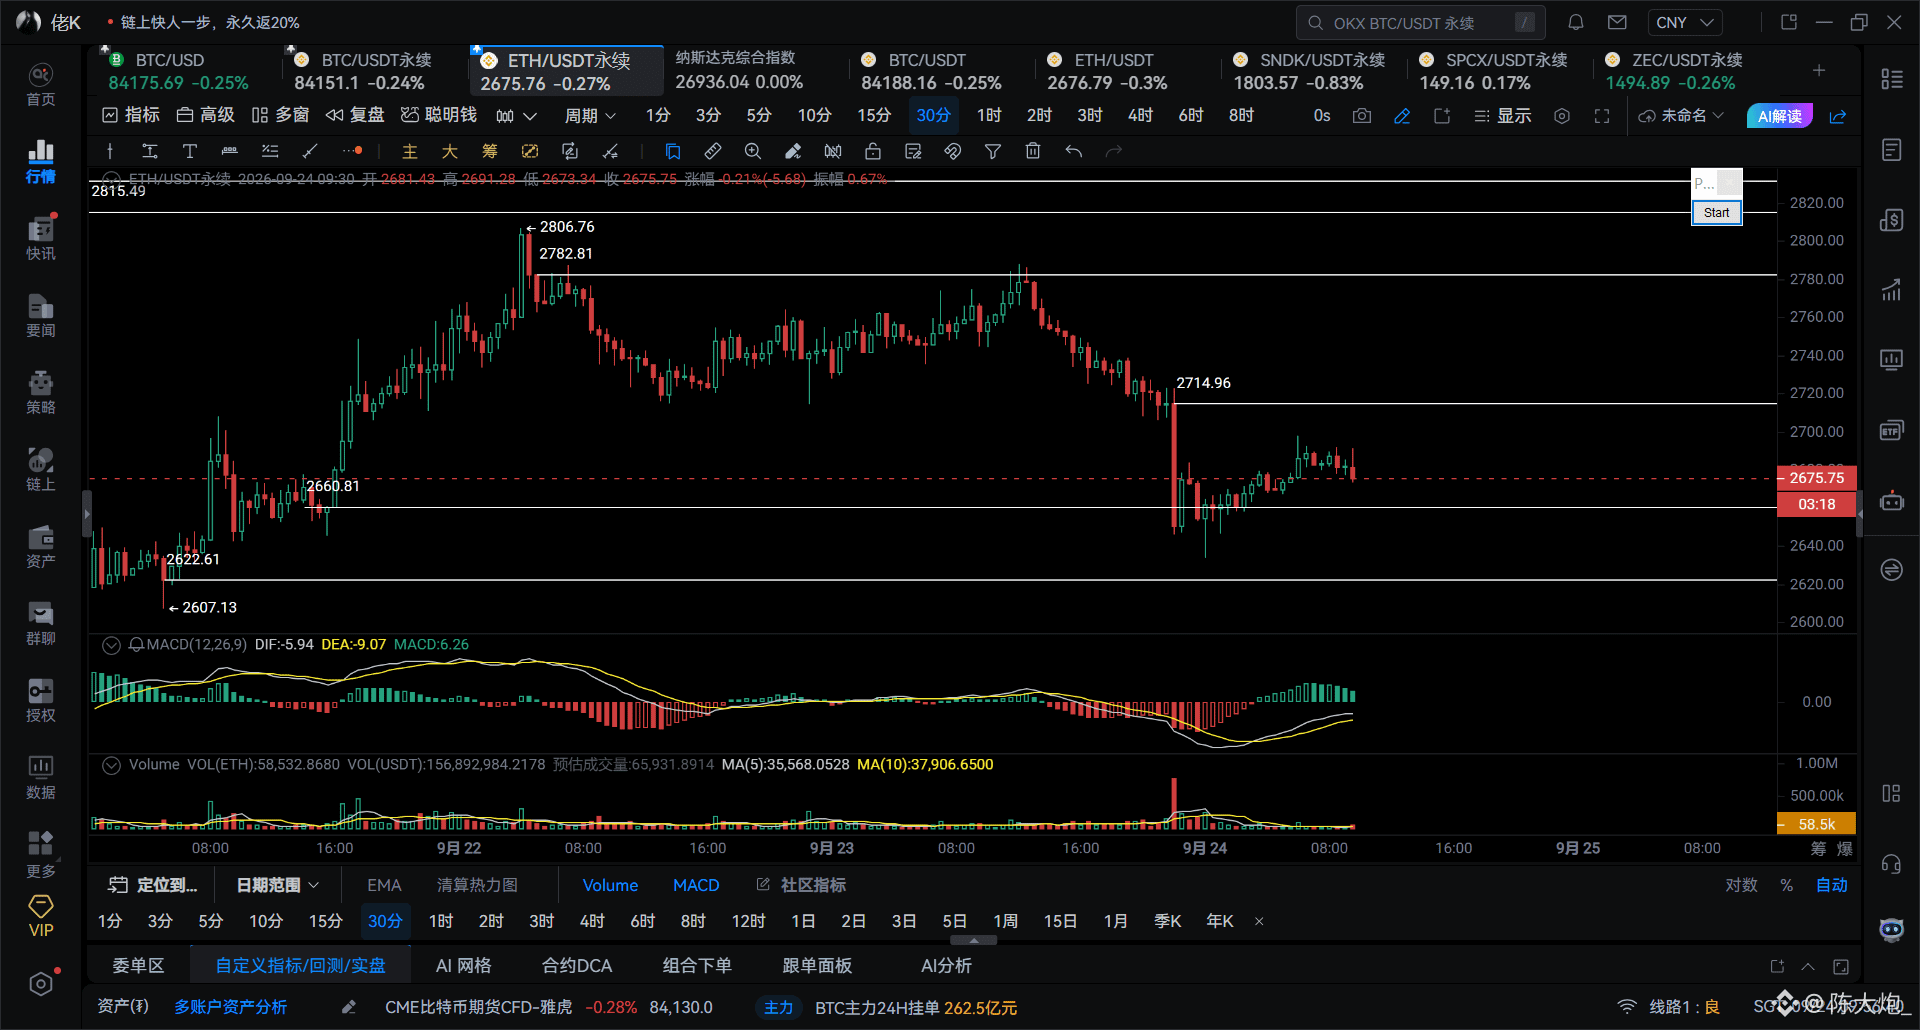

9.24 ETH market analysis
Ethereum’s 5-day line is opening anew—watch to see whether it opens lower and then rises (low-open, high-go). After the pull-up from the 2-day/1-day lines, there is a pullback/adjustment.
A 12-hour top reversal pattern is confirmed.
A high-level “dead cross” forms on the 4/6/8-hour MACD.
A golden cross forms below the waterline on the 1-hour chart.
The 30-minute/45-minute charts show a bottoming trend below the waterline.
On the 15-minute chart, the structure is inverted/crossed (overlaid), so pay attention to the depth of any rebound pullback. Price needs to hold steady in the 2705–2715 range above.
Intraday support: 2660 2622 2584
Intraday resistance: 2710 2754 2783$ETH
Ethereum’s 5-day line is opening anew—watch to see whether it opens lower and then rises (low-open, high-go). After the pull-up from the 2-day/1-day lines, there is a pullback/adjustment.
A 12-hour top reversal pattern is confirmed.
A high-level “dead cross” forms on the 4/6/8-hour MACD.
A golden cross forms below the waterline on the 1-hour chart.
The 30-minute/45-minute charts show a bottoming trend below the waterline.
On the 15-minute chart, the structure is inverted/crossed (overlaid), so pay attention to the depth of any rebound pullback. Price needs to hold steady in the 2705–2715 range above.
Intraday support: 2660 2622 2584
Intraday resistance: 2710 2754 2783$ETH