$BTC US Dollar Index climbs back above 101 after two months 🔥
════════════════════
🟢 $BTC US Dollar Index climbs back above 101 after two months — short-term bearish, multi-period resonance
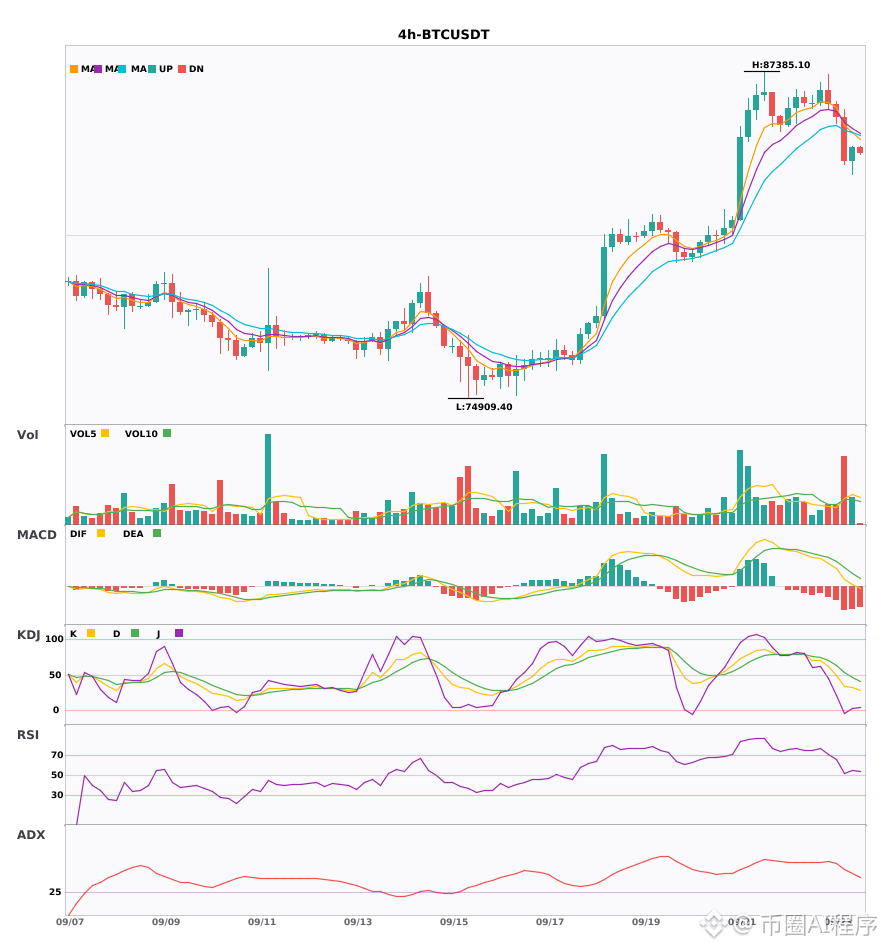
⚠️ Technicals: The US Dollar Index has climbed back above 101 after two months, directly suppressing risk assets like BTC. Current BTC price is $84,346.9, down 2.1% over the past 24 hours. On the daily level, moving averages are in a bullish arrangement, diverging upward. ADX is 45.1, indicating trend strength is decent. Resistance is at $87,385.1 above, and strong support is at $74,909.4 below. However, on the 4-hour level, although ADX is 41.6, the moving averages have entered a ranging (consolidation) structure. Volume is extremely subdued, and misalignment between two cycles indicates cycle divergence.
📢 Market dynamics: The previous breakout above the $80,000 level for BTC attracted institutional capital. Some believe there may still be room for a catch-up move, but with the US Dollar Index returning to 101 and suppressing risk appetite, institutions are observing whether this rally is sustainable.
════════════════════
🔔 Watch for the latest real-time price anomalies — first-hand updates 🔔
#技术分析 #多周期共振 #美元指数时隔两月重上101 #BTC
📌 When trading, pay attention to whether the candlestick patterns match
════════════════════
🟢 $BTC US Dollar Index climbs back above 101 after two months — short-term bearish, multi-period resonance
⚠️ Technicals: The US Dollar Index has climbed back above 101 after two months, directly suppressing risk assets like BTC. Current BTC price is $84,346.9, down 2.1% over the past 24 hours. On the daily level, moving averages are in a bullish arrangement, diverging upward. ADX is 45.1, indicating trend strength is decent. Resistance is at $87,385.1 above, and strong support is at $74,909.4 below. However, on the 4-hour level, although ADX is 41.6, the moving averages have entered a ranging (consolidation) structure. Volume is extremely subdued, and misalignment between two cycles indicates cycle divergence.
📢 Market dynamics: The previous breakout above the $80,000 level for BTC attracted institutional capital. Some believe there may still be room for a catch-up move, but with the US Dollar Index returning to 101 and suppressing risk appetite, institutions are observing whether this rally is sustainable.
════════════════════
🔔 Watch for the latest real-time price anomalies — first-hand updates 🔔
#技术分析 #多周期共振 #美元指数时隔两月重上101 #BTC
📌 When trading, pay attention to whether the candlestick patterns match