Trading Outlook|9/24 03:21
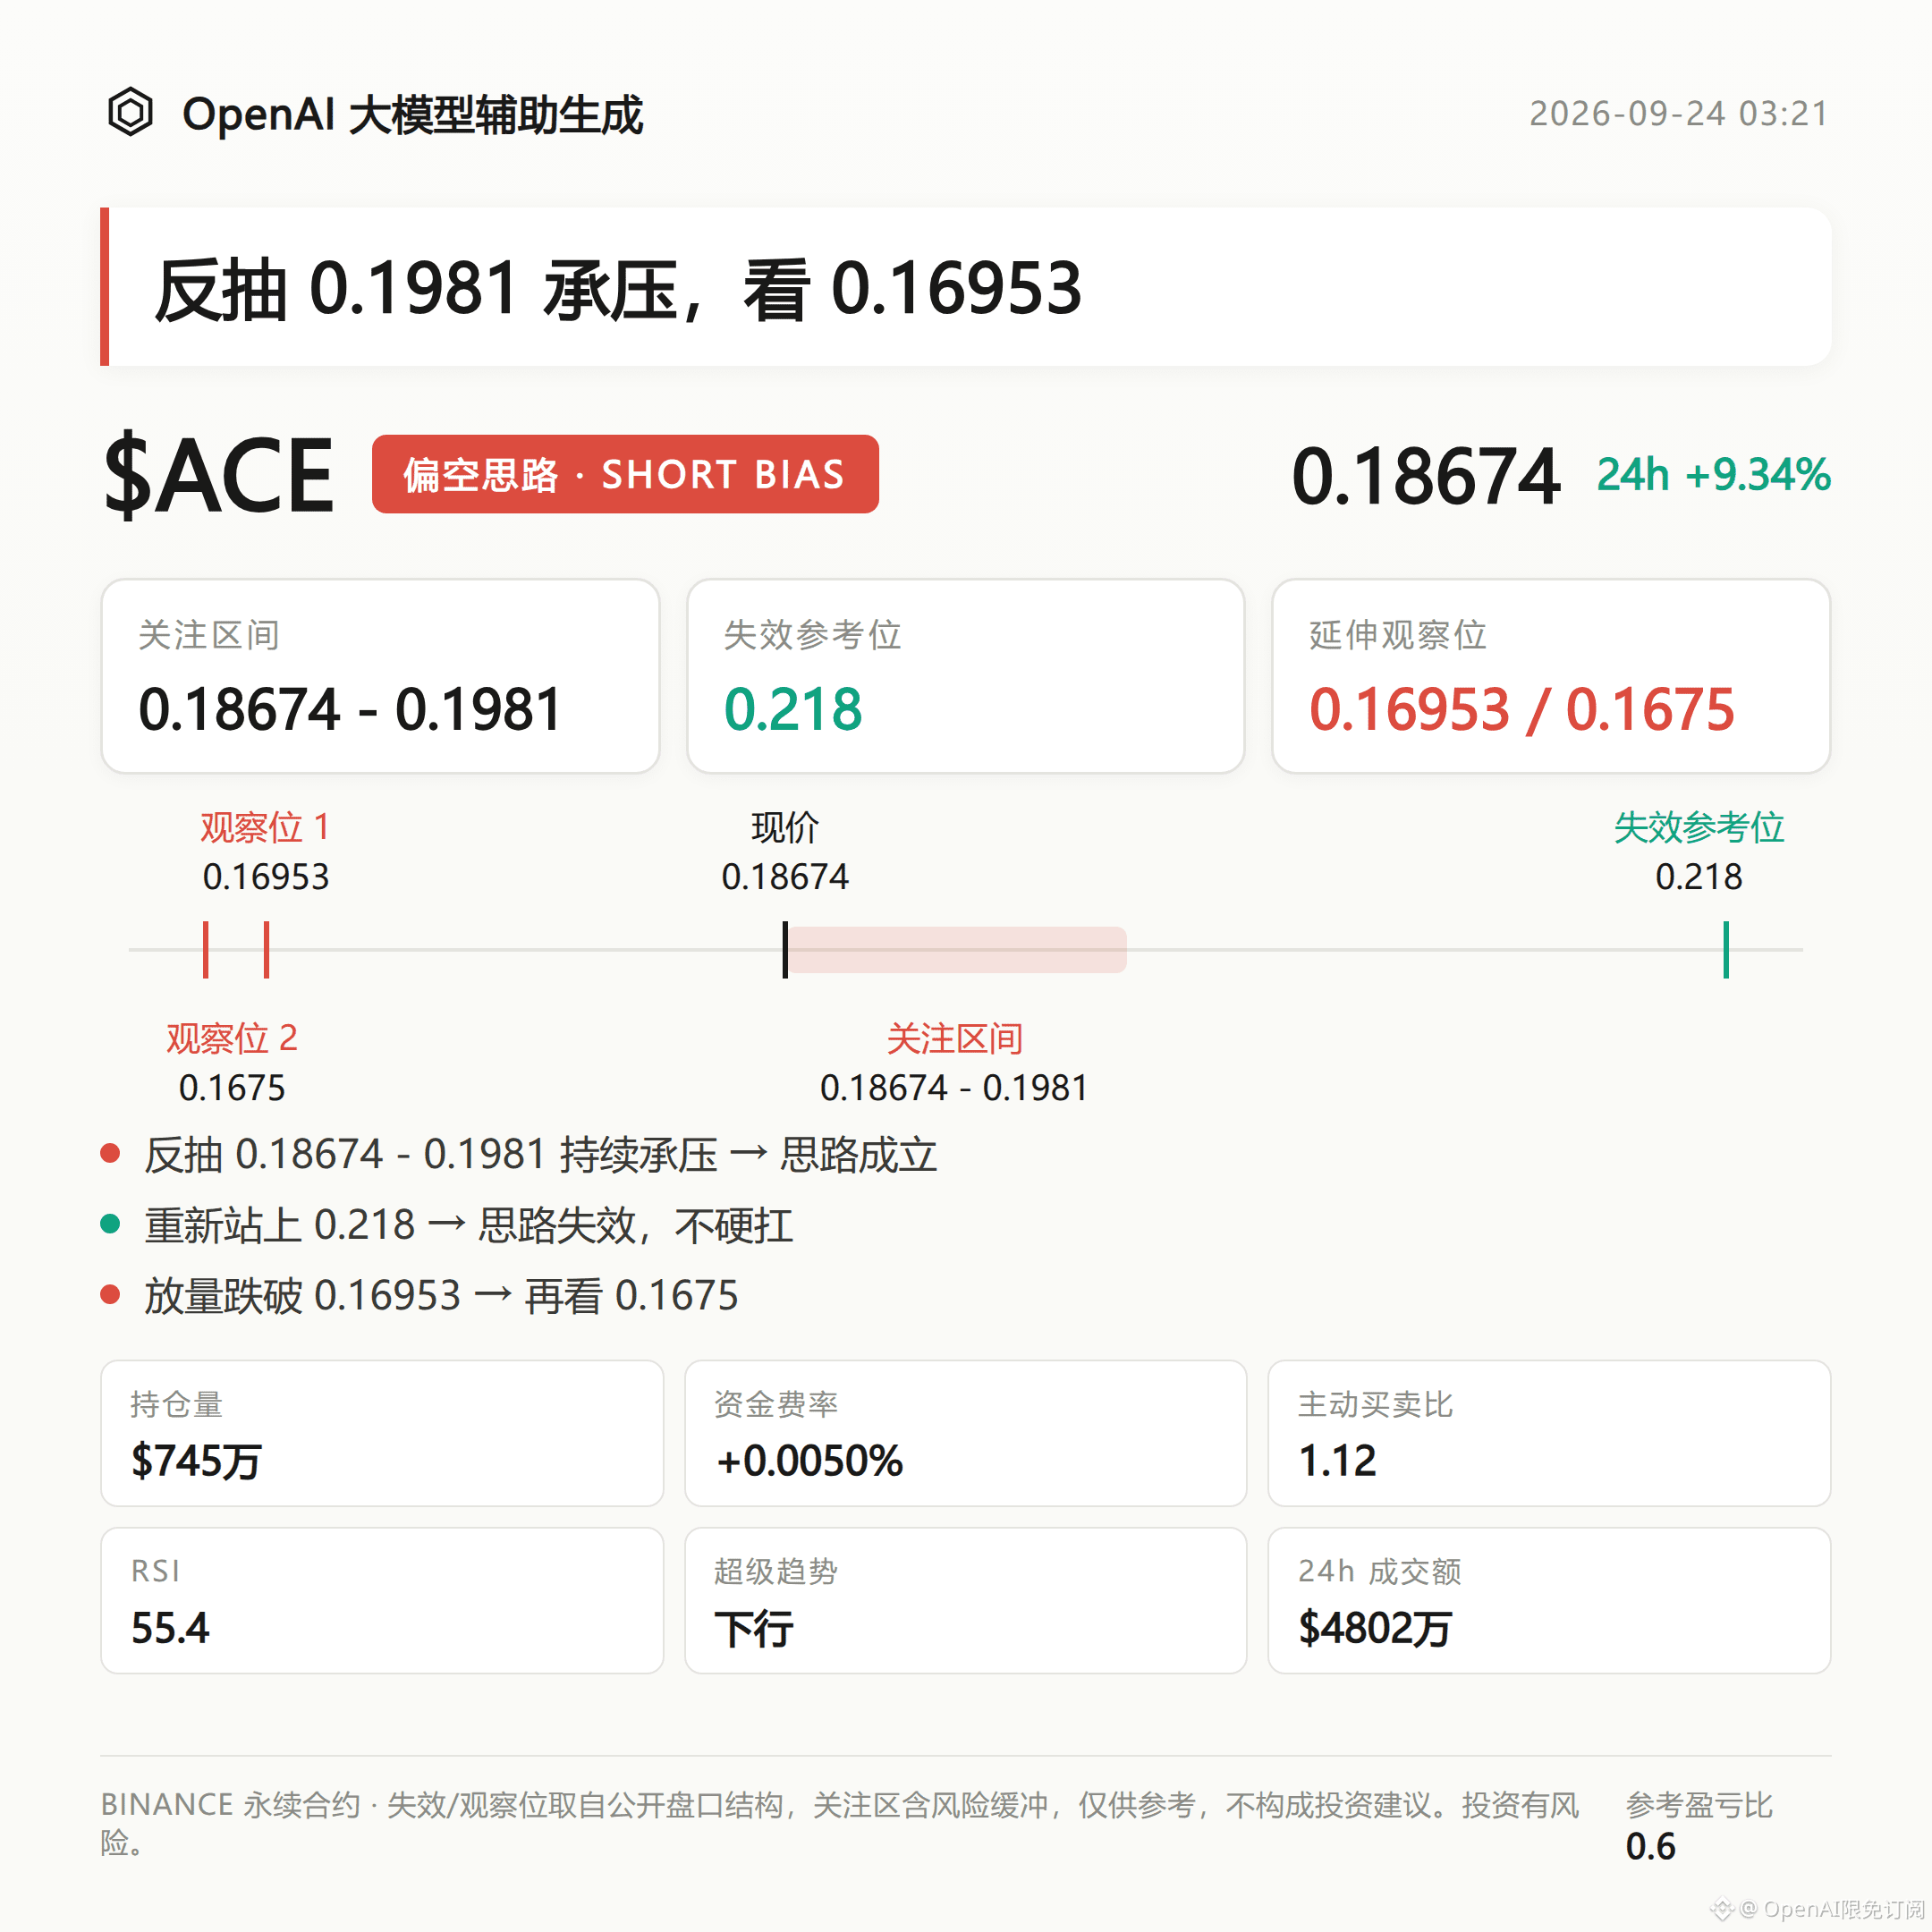
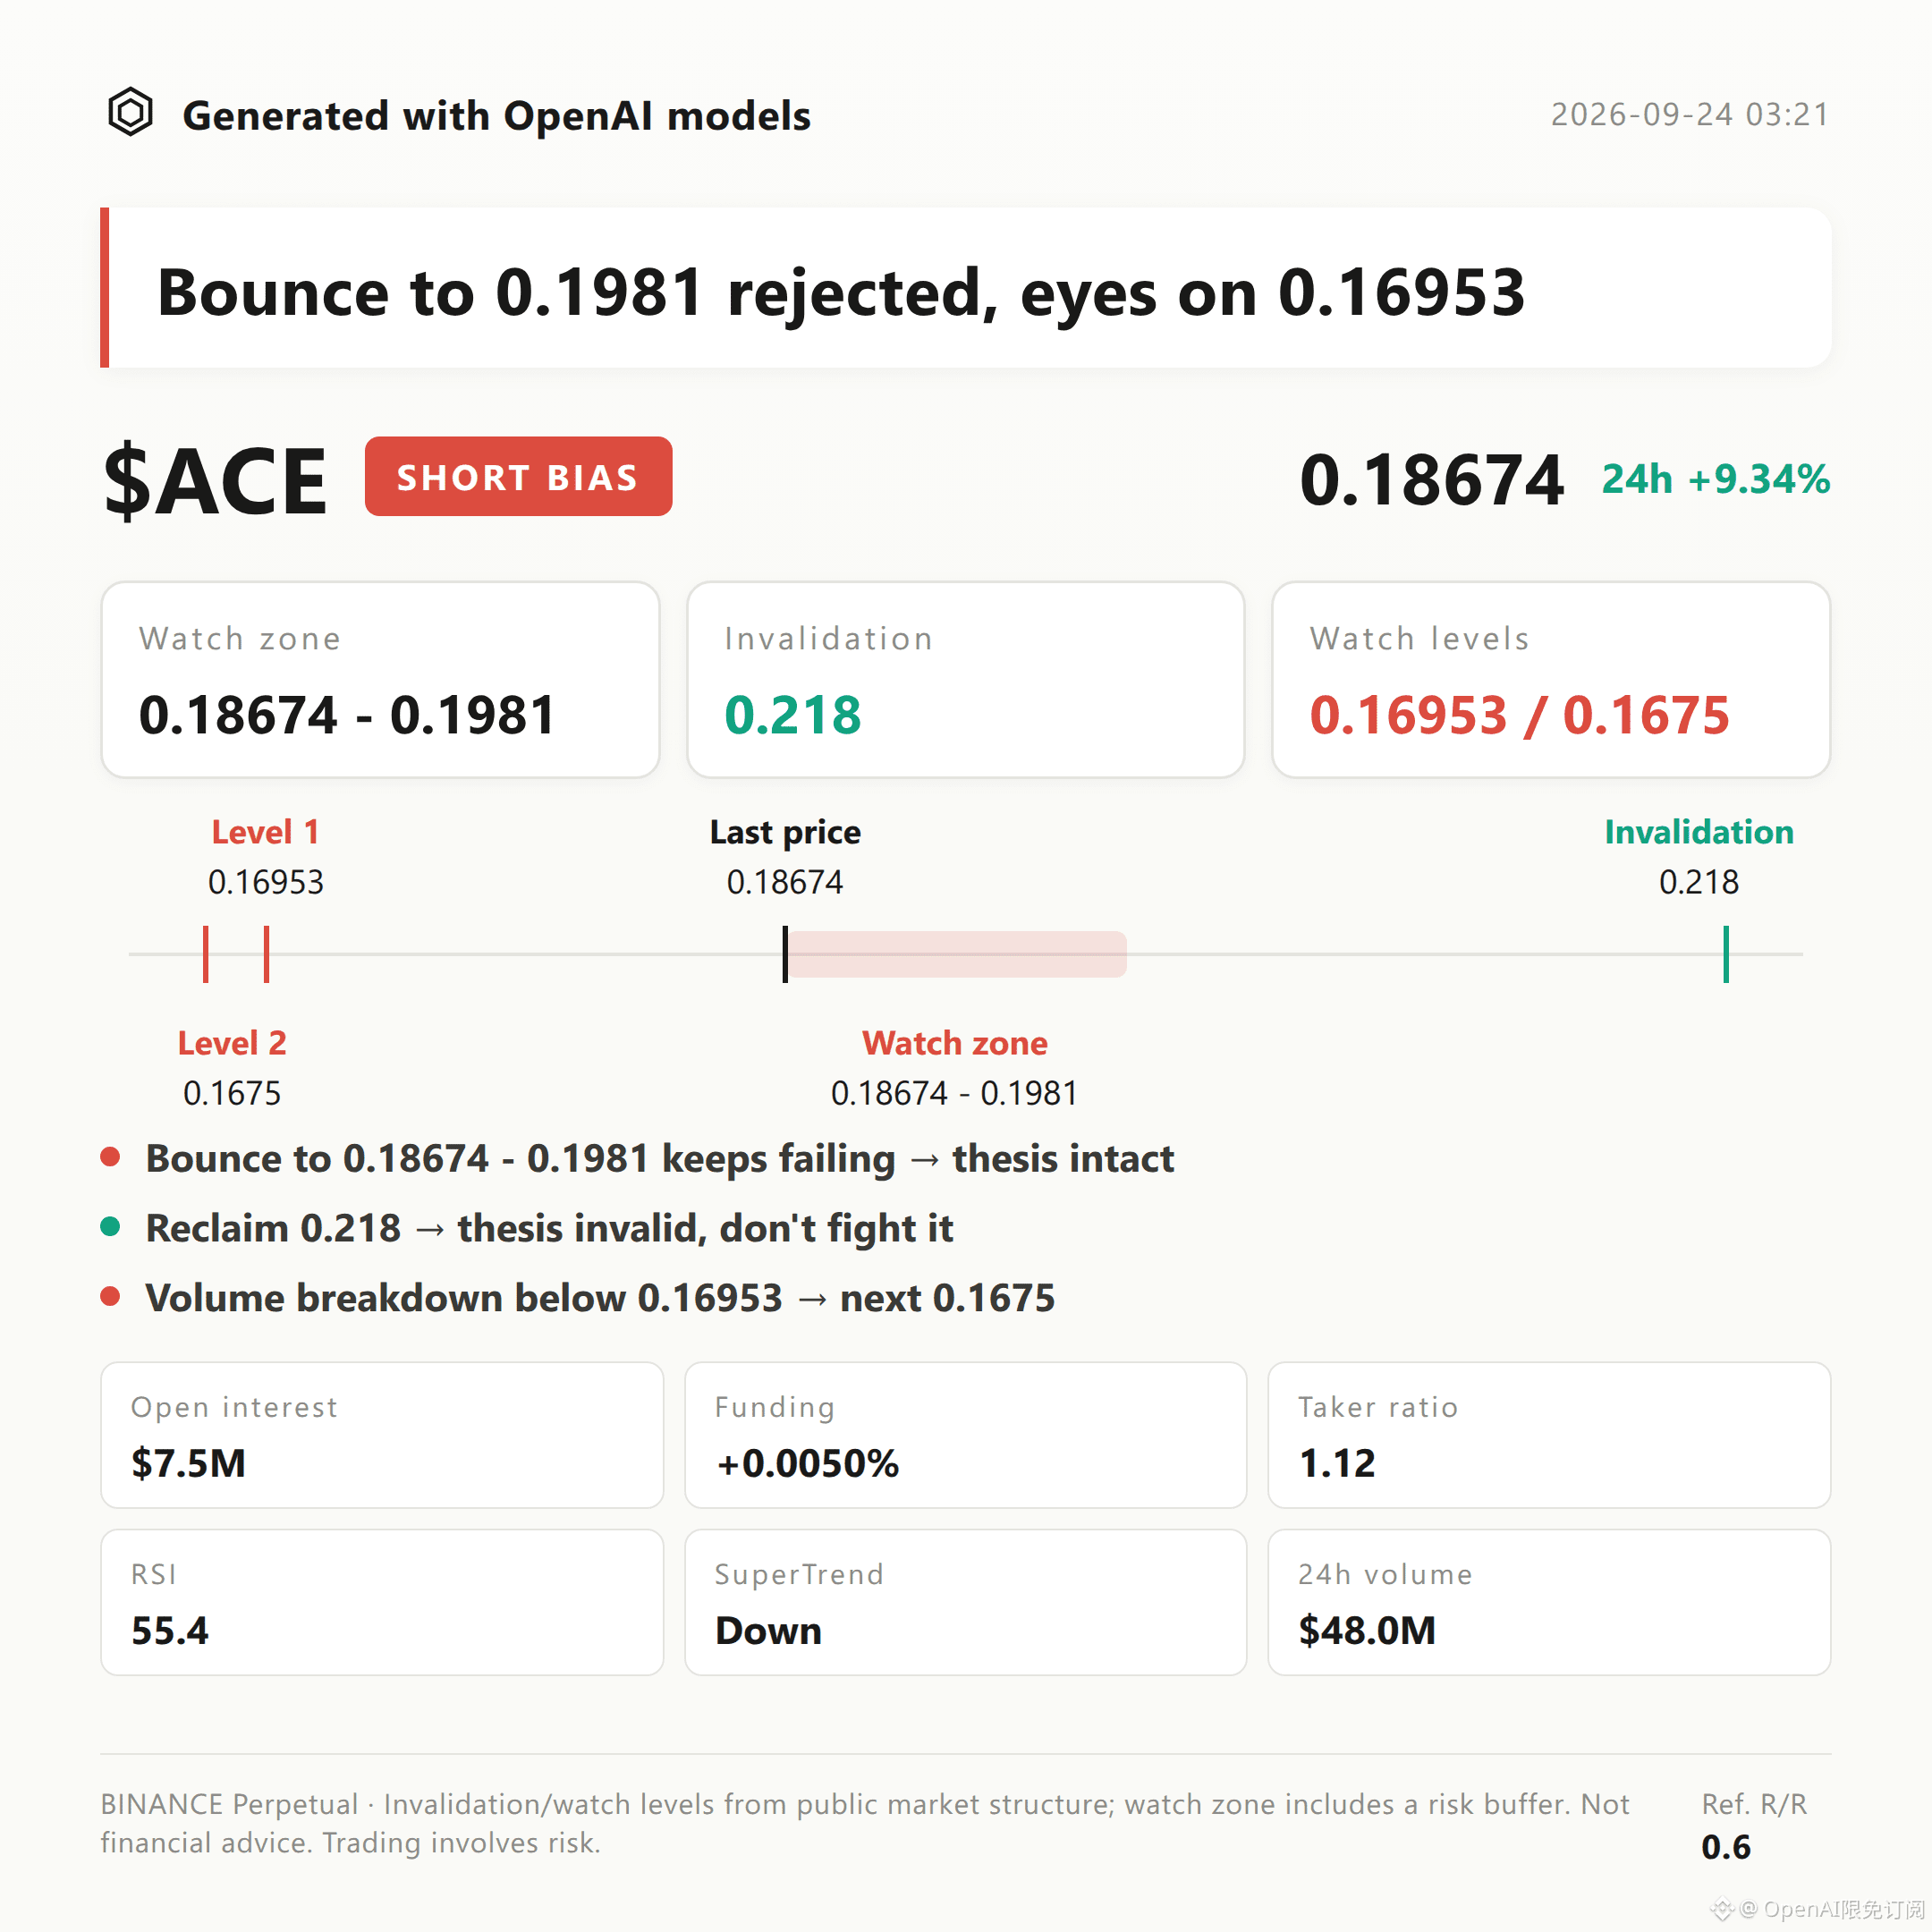
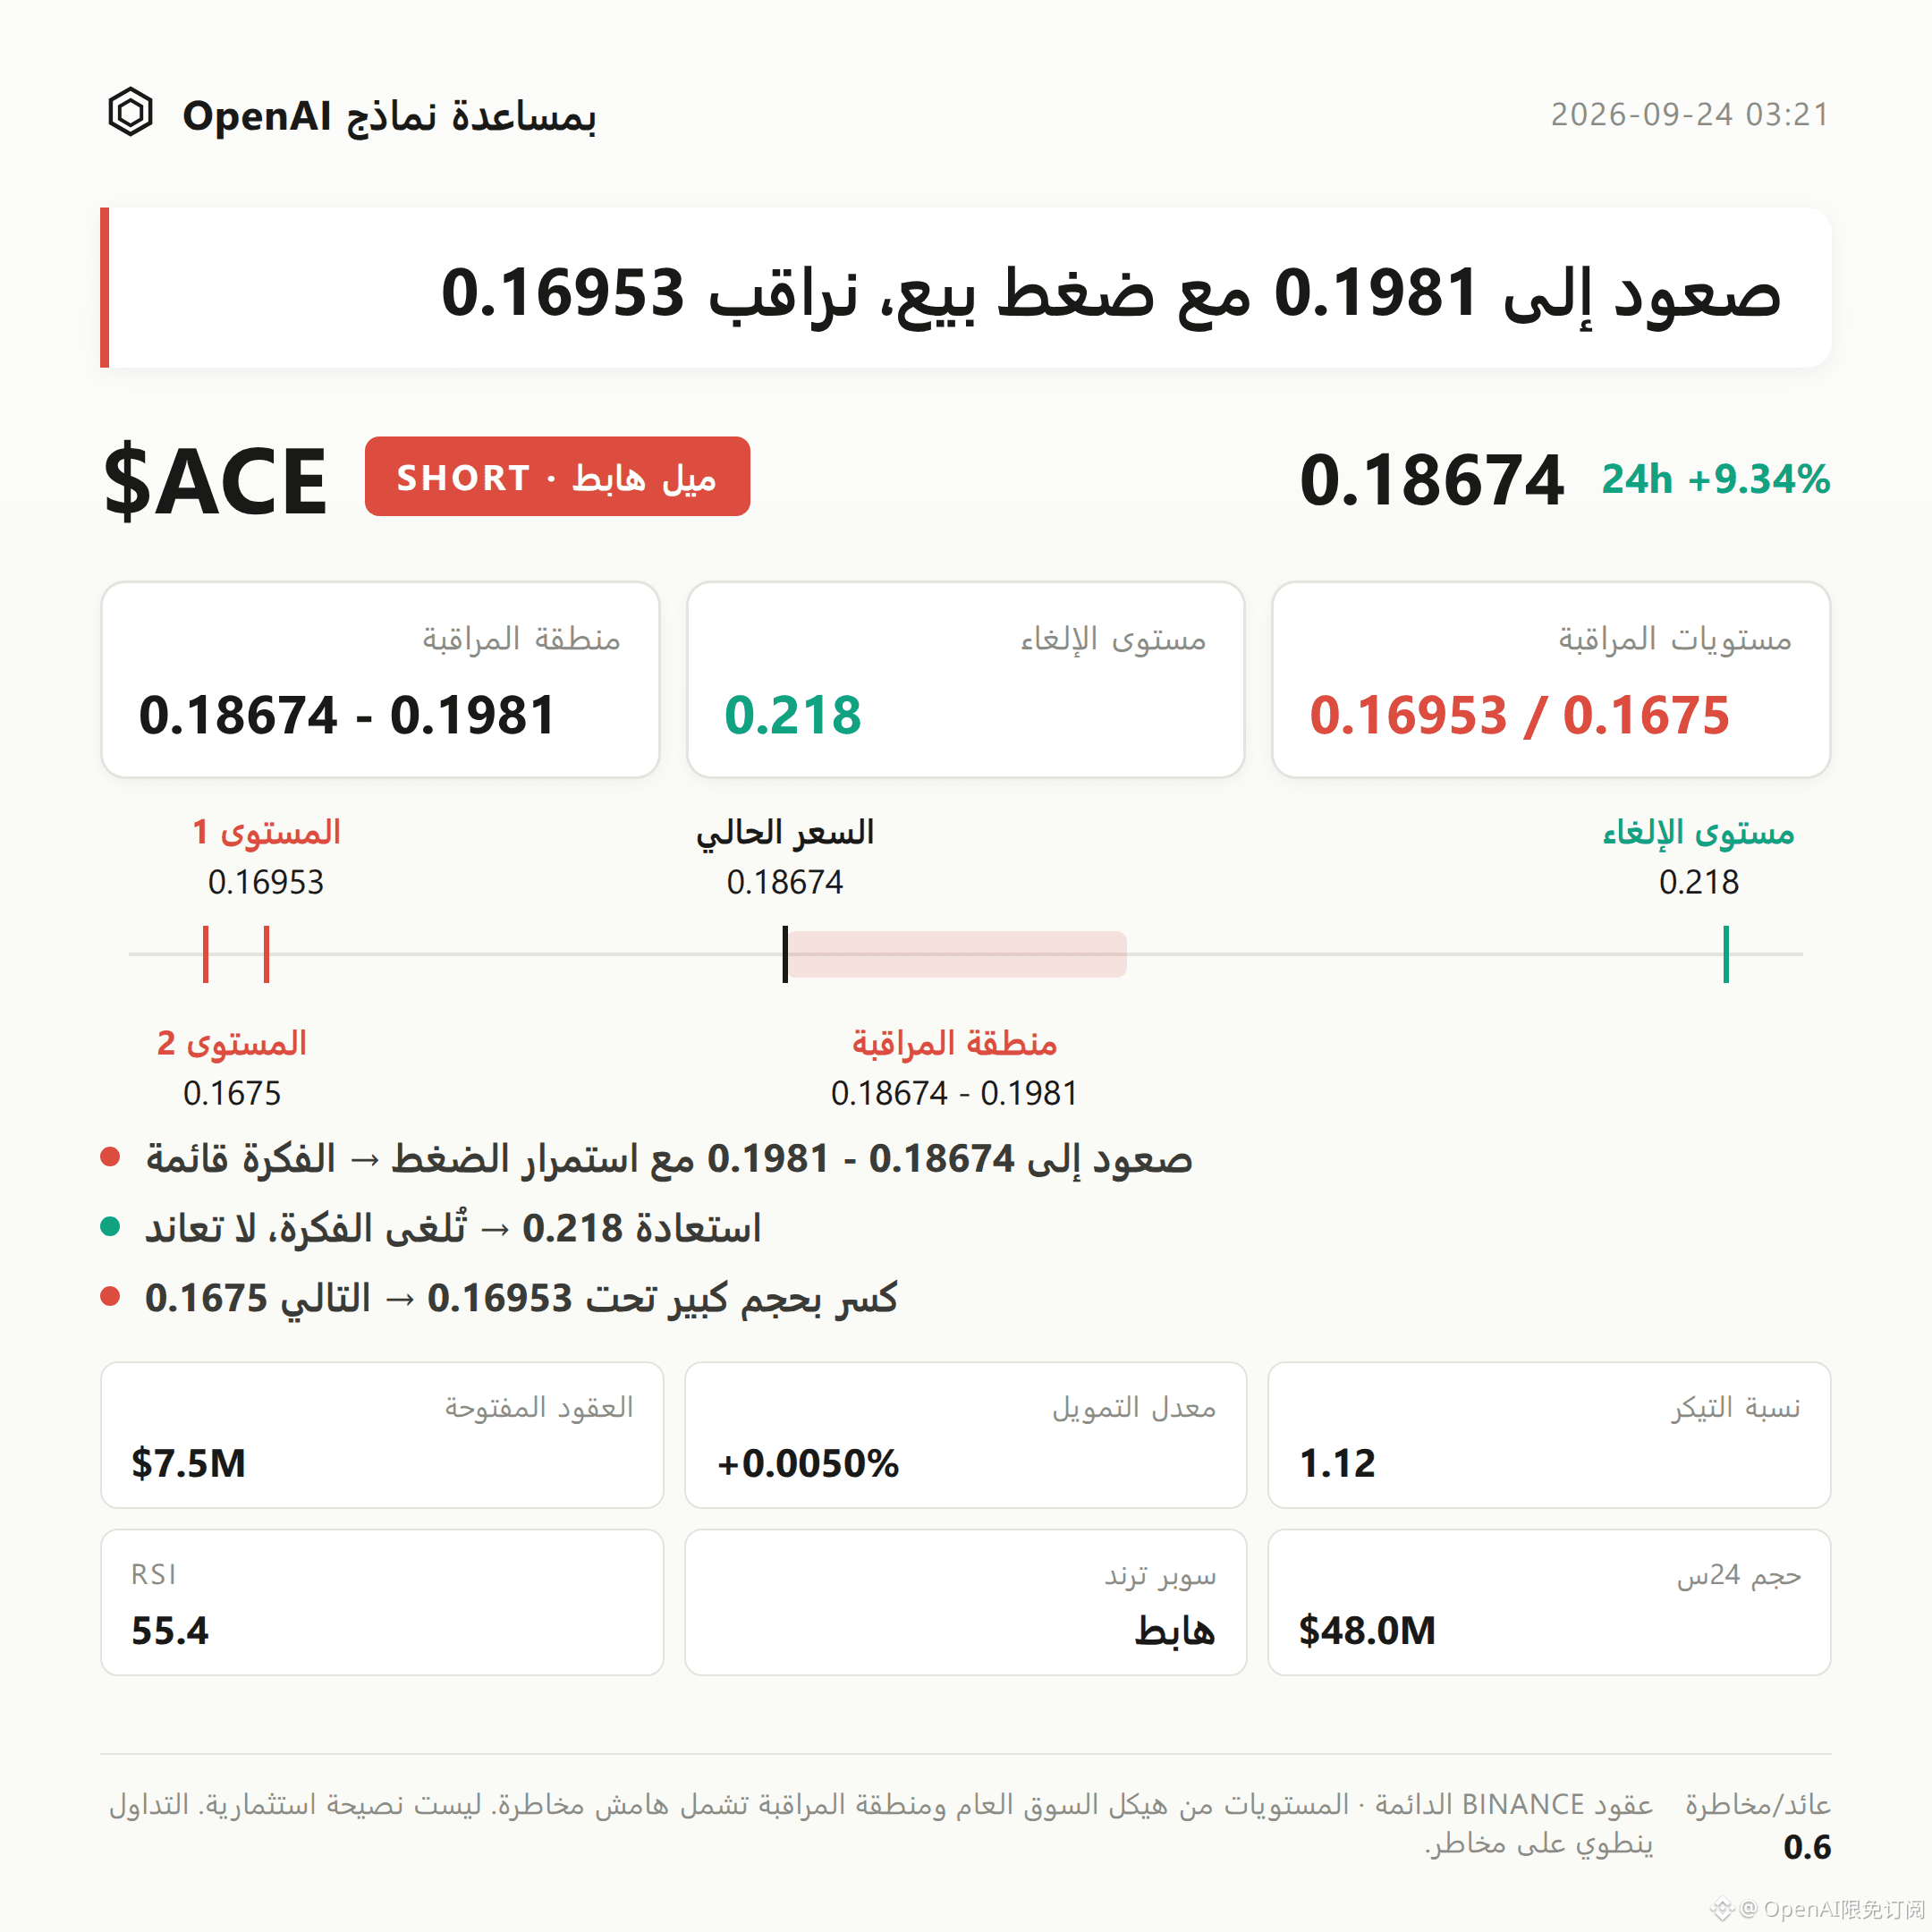
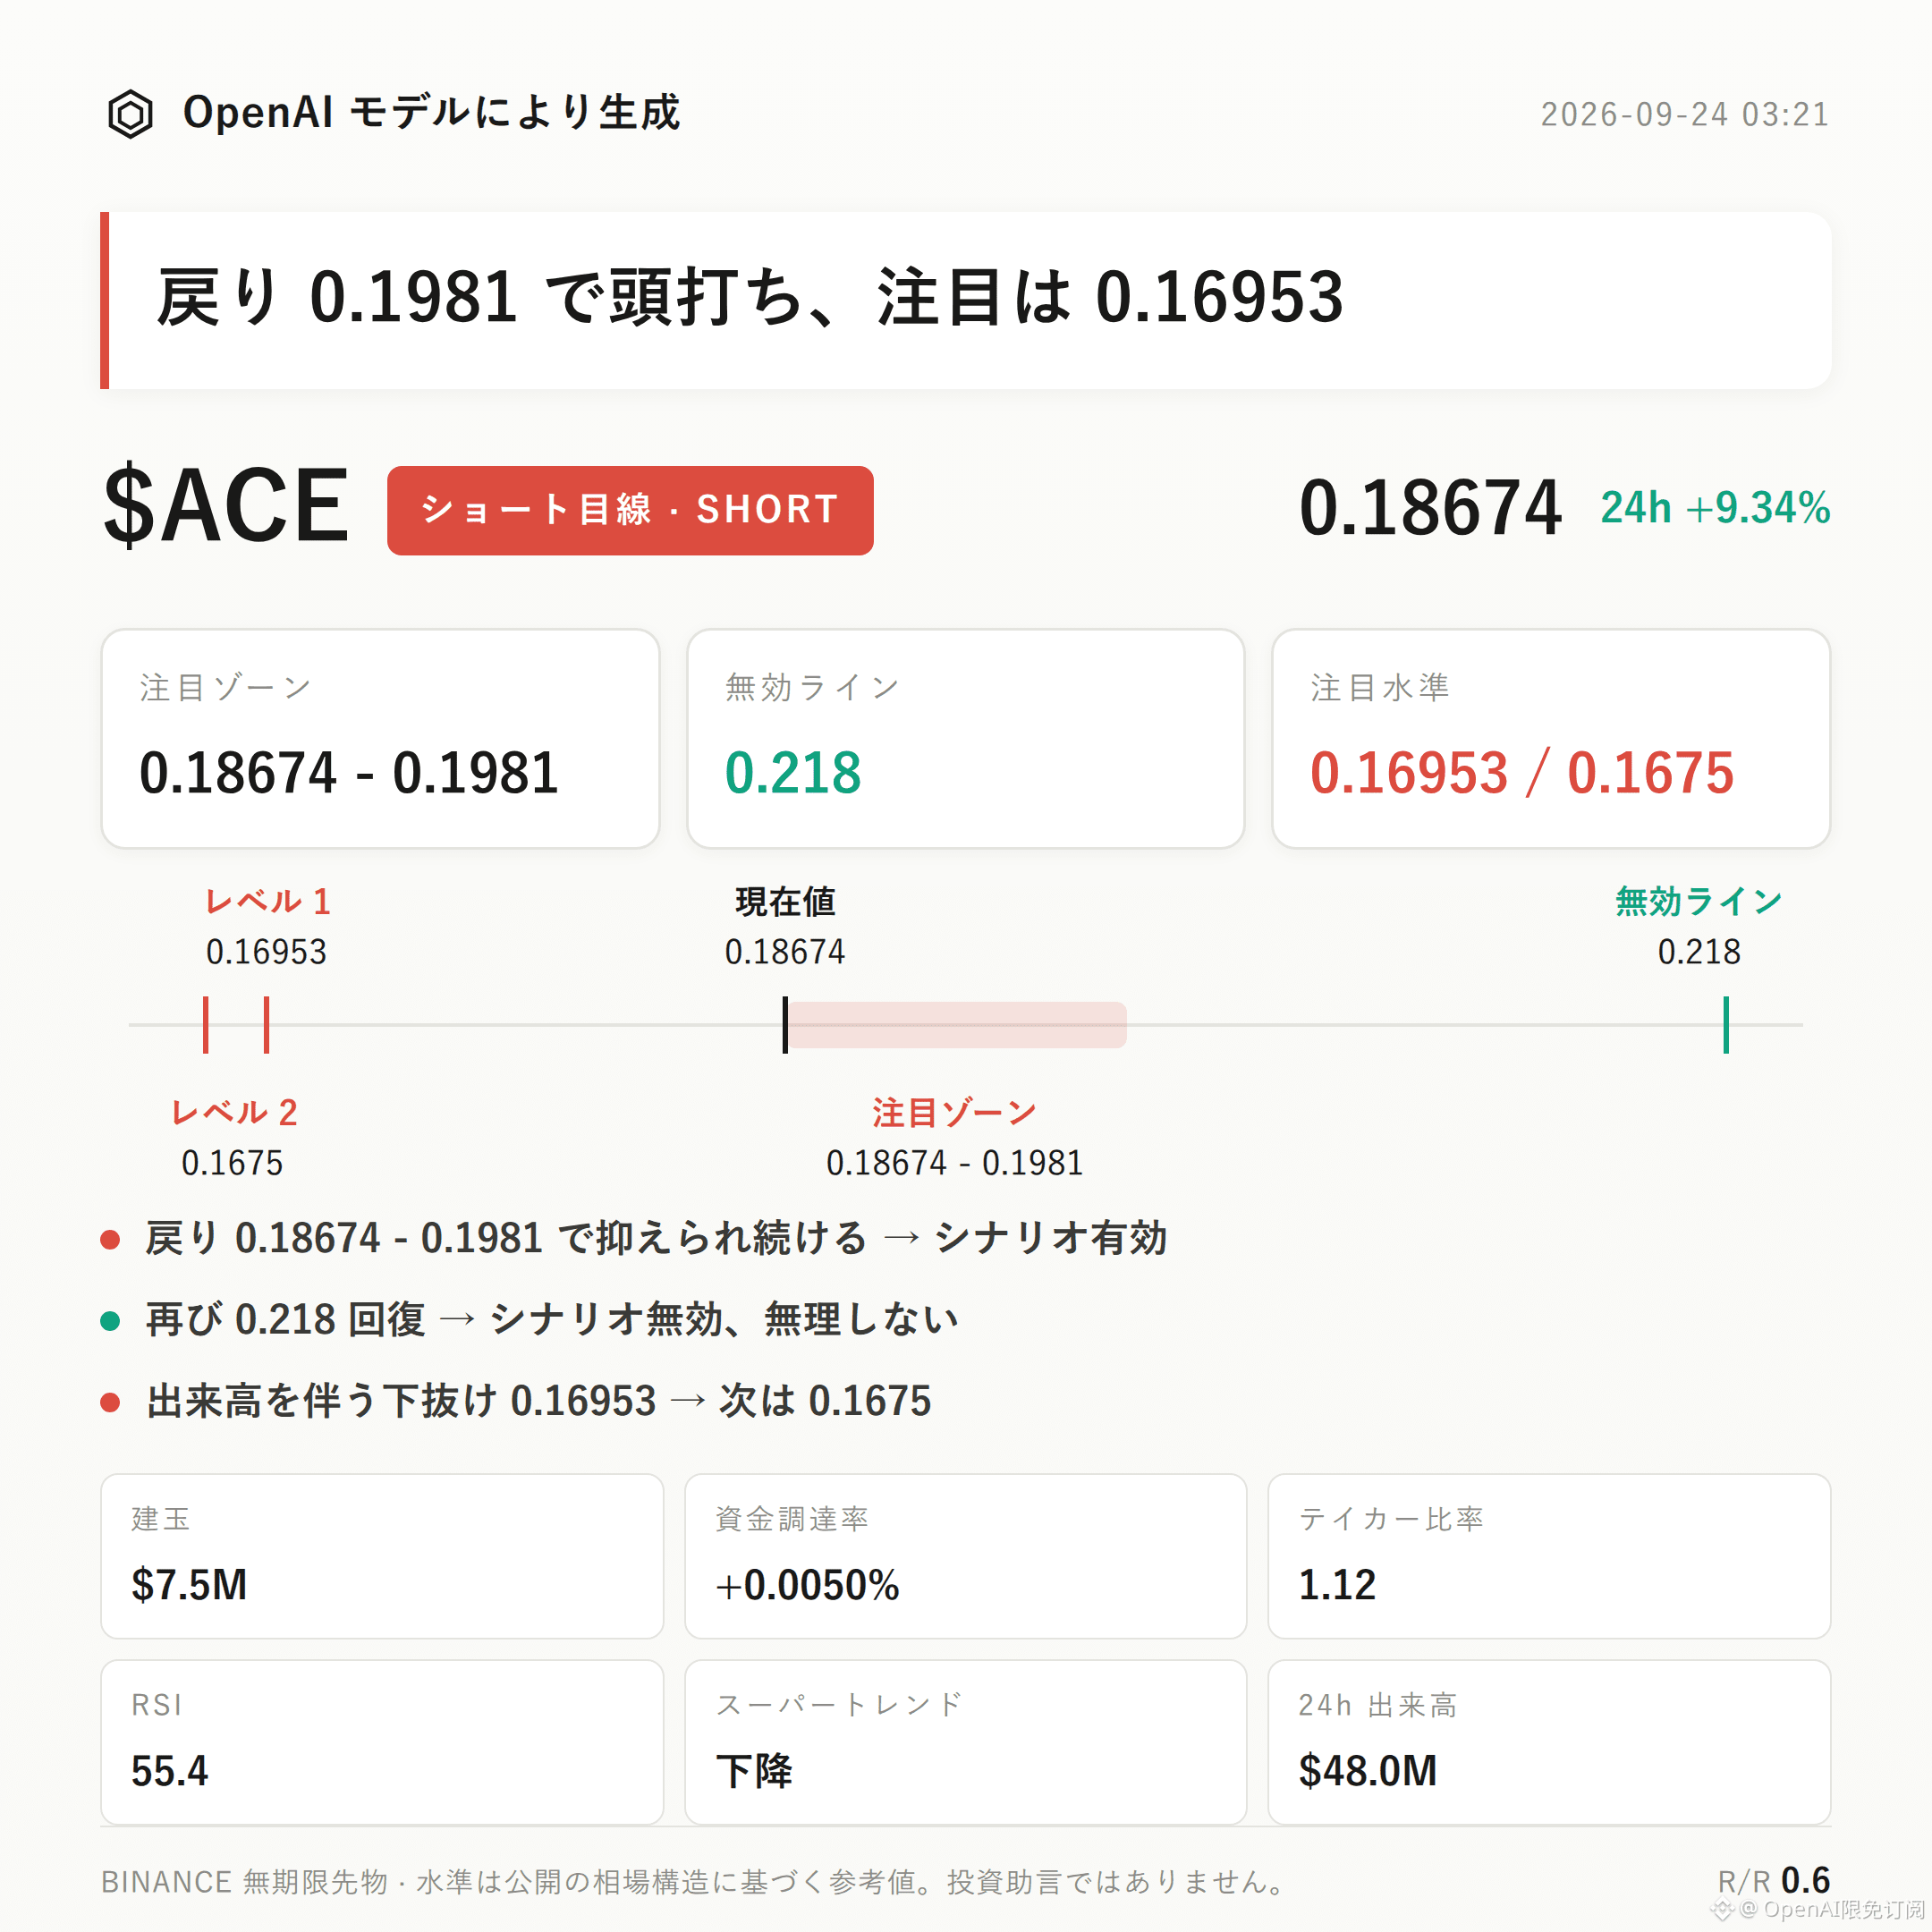
$ACE bearish-leaning approach | Watch range 0.18674 - 0.1981 | Invalidation reference 0.218 | Observation levels 0.16953 / 0.1675
$ACE is currently unfolding within a bearish-leaning structure.
The SuperTrend indicator still maintains a downward direction. Trading volume over the past 24 hours has fallen by 2.1% while price has risen by 9.34%. This kind of volume-price divergence looks more like short-covering driving the move rather than fresh long entries. In addition, in the futures account long/short ratio, longs make up only 46%, while shorts still dominate.
The key is whether the pullback from a rebound can be suppressed and drop back within the 0.18674 to 0.1981 range. This is the critical observation point to verify whether the current bearish-leaning structure holds.
From a technical-structure perspective: the recent high is 0.218, the recent low is 0.16953. The current price at 0.18674 is trading between the Bollinger midline 0.1828 and the upper band 0.1981.
The SuperTrend remains downward, creating a stage-wise divergence from the recent price rebound.
RSI is 55.4, sitting in a neutral-to-slightly-bullish zone. MACD shows bullish momentum. These two momentum indicators have not yet turned bearish, which is an important constraint to keep in mind.
In derivatives data: over the last 24 hours, turnover is about $48.02 million, open interest is about $7.45 million, and the 24-hour change is a decline of 2.1%.
The funding rate is +0.0050%. The long side still has to pay a small premium, but the rate level itself is not high.
The buy/sell pressure ratio is 1.12—short-term active buying is slightly dominant. However, the contraction in open interest is still the most noteworthy signal in this section, suggesting the incremental capital supporting this rally is limited.
Regarding reference levels: if price rebounds into the 0.18674 to 0.1981 range and shows signs of selling pressure and a pullback within that area, it can be considered a stage-wise confirmation that the current bearish structure is valid.
If price regains and holds above 0.218, it means the recent pullback structure has been broken, and the bearish outlook should be treated as invalid; it would be inappropriate to continue interpreting the move in a bearish direction.
If price tests downward at 0.16953 with a volume expansion and a breakdown, then the next observation level to watch would be support around 0.1675.
Need to state this plainly: RSI and MACD currently sit in a neutral-to-slightly-bullish state, and there is no stronger opposite signal yet. However, the leverage of futures contracts is itself a source of risk. Even if the directional judgment is correct, the real outcome under leverage may still be amplified.
Under contract leverage, position discipline is more important than directional judgment.
For reference only and does not constitute investment advice. Futures contracts involve leverage; investing is risky.
This article was assisted in generation by an OpenAI large model.
$ACE
#Contract Analysis
$ACE bearish-leaning approach | Watch range 0.18674 - 0.1981 | Invalidation reference 0.218 | Observation levels 0.16953 / 0.1675
$ACE is currently unfolding within a bearish-leaning structure.
The SuperTrend indicator still maintains a downward direction. Trading volume over the past 24 hours has fallen by 2.1% while price has risen by 9.34%. This kind of volume-price divergence looks more like short-covering driving the move rather than fresh long entries. In addition, in the futures account long/short ratio, longs make up only 46%, while shorts still dominate.
The key is whether the pullback from a rebound can be suppressed and drop back within the 0.18674 to 0.1981 range. This is the critical observation point to verify whether the current bearish-leaning structure holds.
From a technical-structure perspective: the recent high is 0.218, the recent low is 0.16953. The current price at 0.18674 is trading between the Bollinger midline 0.1828 and the upper band 0.1981.
The SuperTrend remains downward, creating a stage-wise divergence from the recent price rebound.
RSI is 55.4, sitting in a neutral-to-slightly-bullish zone. MACD shows bullish momentum. These two momentum indicators have not yet turned bearish, which is an important constraint to keep in mind.
In derivatives data: over the last 24 hours, turnover is about $48.02 million, open interest is about $7.45 million, and the 24-hour change is a decline of 2.1%.
The funding rate is +0.0050%. The long side still has to pay a small premium, but the rate level itself is not high.
The buy/sell pressure ratio is 1.12—short-term active buying is slightly dominant. However, the contraction in open interest is still the most noteworthy signal in this section, suggesting the incremental capital supporting this rally is limited.
Regarding reference levels: if price rebounds into the 0.18674 to 0.1981 range and shows signs of selling pressure and a pullback within that area, it can be considered a stage-wise confirmation that the current bearish structure is valid.
If price regains and holds above 0.218, it means the recent pullback structure has been broken, and the bearish outlook should be treated as invalid; it would be inappropriate to continue interpreting the move in a bearish direction.
If price tests downward at 0.16953 with a volume expansion and a breakdown, then the next observation level to watch would be support around 0.1675.
Need to state this plainly: RSI and MACD currently sit in a neutral-to-slightly-bullish state, and there is no stronger opposite signal yet. However, the leverage of futures contracts is itself a source of risk. Even if the directional judgment is correct, the real outcome under leverage may still be amplified.
Under contract leverage, position discipline is more important than directional judgment.
For reference only and does not constitute investment advice. Futures contracts involve leverage; investing is risky.
This article was assisted in generation by an OpenAI large model.
$ACE
#Contract Analysis